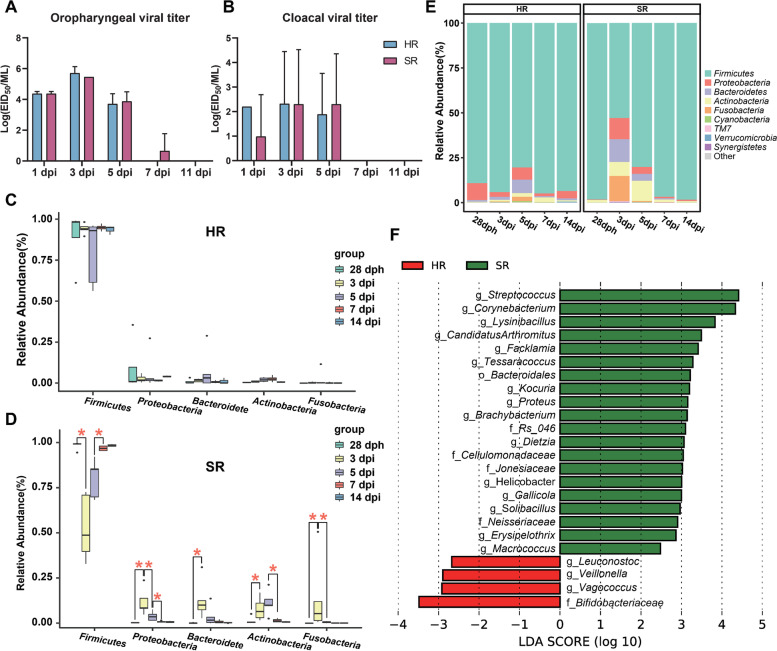
Fig. 5.
Viral titers and gut microbiota of chicks infected with H9N2 virus in the hen-reared (HR) and separately reared (SR) groups of chicks. A, B Viral titers in oropharyngeal and cloacal swabs of post-H9N2-infected chickens. Chicks (28 dph) were intranasally inoculated with 10−6EID50/0.2ml of LPAIH9N2. EID50 was calculated by the Reed and Muench method. C, D Comparison of the relative abundances of the major bacterial phyla representing the gut microbiota of HR and SR groups after H9N2 infection; *P < 0.05; the horizontal bar in the boxes represents the median. The top and bottom of the boxes represent the 75th and 25th percentiles, respectively. The upper and lower whiskers extend to data not exceeding 1.5× the interquartile range from the upper edge and lower edge of the box, respectively. E Phylum-level composition of the gut microbiota in the post-H9N2-infected chickens. F LEfSe analysis of the 16SrRNA sequences of the post H9N2 infected chickens (P < 0.01, LDA > 2)

