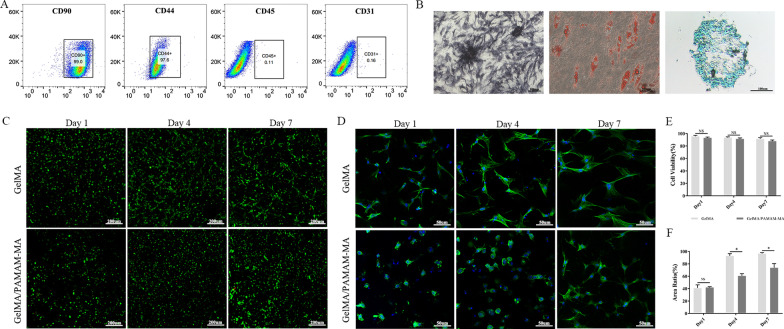
Fig. 3.
Identification of rASCs and in vitro biocompatibility evaluations. A FCM analysis of the expression of stem cell identification-related antibodies in rASCs. B Representative images of the multidifferentiation ability test of rASCs. Left, ALP staining, middle, Oil red O staining, right, Alcian blue staining. Scare bars: 100 μm. C Representative images of live/dead rASCs cultured in GelMA and GelMA/PAMAM-MA hydrogels on days 1, 4 and 7. Green fluorescence indicates live cells, and red fluorescence indicates dead cells. Scare bars: 200 μm. D Representative images of phalloidin/DAPI fluorescence images of rASCs cultured in two groups of GelMA/PAMAM-MA hydrogels after 1 day, 4 days and 7 days. Green fluorescence indicates the cytoskeleton, and blue fluorescence indicates the nucleus. Scare bars: 50 μm. E Quantification of the live and dead cells. F Quantification of the cell spreading areas of rASCs cultured in two groups of hydrogels. Error bar: Mean ± SD, * represents p < 0.05

