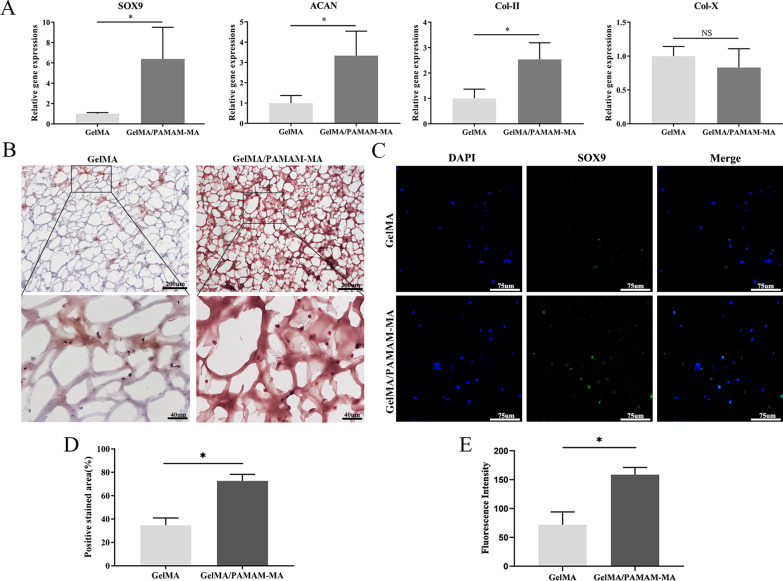
Fig. 4.
In vitro chondrogenic differentiation analysis of 3D-cultured rASCs. A Quantitative real-time PCR analysis of the expression of chondrogenic differentiation-related genes in rASCs encapsulated in GelMA and GelMA/PAMAM-MA hydrogels. B Representative images of safranin-O staining after 14 days of chondrogenic induction culture. Scale bars: above, 200 μm; below, 40 μm. C Representative images of immunofluorescence staining of SOX9 in rASCs encapsulated in two groups of hydrogels after 21 days of chondrogenic induction culture. Scale bars: 75 μm. D Quantification of the positively stained area of GAGs in the two groups of hydrogels. E Quantification of SOX9 expression in the two groups of hydrogels. Error bar: Mean ± SD, * represents p < 0.05

