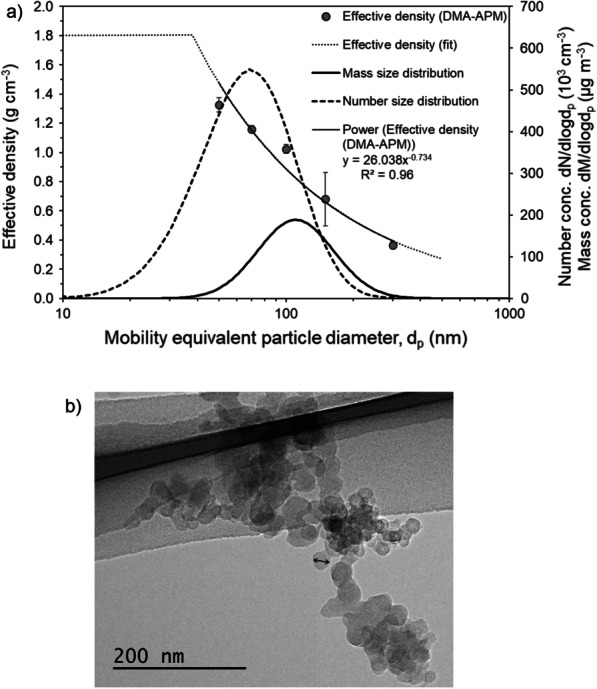
Fig. 2.

a The particle number and mass size distribution together with the average effective density measured with the DMA-APM (± 1 SD). The effective density (, g cm−3) describes the ratio between measured particle mass and mobility size-derived volume (assuming a sphere). The effective density was measured at 50, 70, 100, 150, and 300 nm as illustrated. The effective density is extrapolated, and below 40 nm the inherent material density of soot (1.8 g cm−3) is used. The mass size distribution is derived from the number size distribution and effective density. b TEM image of a cluster of particles (soot agglomerates) generated during the HVOPM+NOx exposure, with an arrow showing a primary particle of approximately 25 nm in diameter
