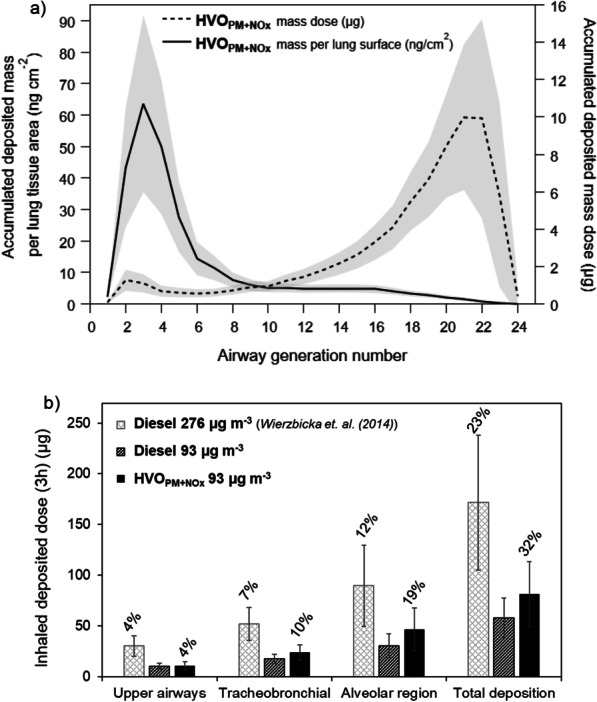
Fig. 3.

a The predicted average accumulated deposited particle dose (gravimetric PM1) in each lung genereation for all test subjects expressed as mass (µg) and mass per lung area tissue (ng cm−2) for the HVOPM+NOx 3 h exposure. The shaded area represents the group’s individual variability of ± 1 std. dev. Deposited dose in a comprises calculated deposition in the tracheobronchial region (airway generation number 0–15) and alveolar region (gen. 16–24), but not in upper airways. b The predicted average accumulated deposited particle dose (µg) in the upper airways, tracheobronchial region and alvolar region as well as the total deposited dose for the HVOPM+NOx exposure. Additionally presented is a comparison to the calculated deposition of petroleum diesel from a previous exposure study with both original (276 µg m−3) and reduced mass concentration (93 µg m−3) [10]. The number on top of each bar represents the fraction of the deposited mass compared to the total exposure mass concentration. The error bars represent the group’s individual variability of ± 1 std. dev. The deposited fraction (%) is the same for both petrolum diesel aerosols (given only above the first bars) as it is independent on the exposure mass concentration
