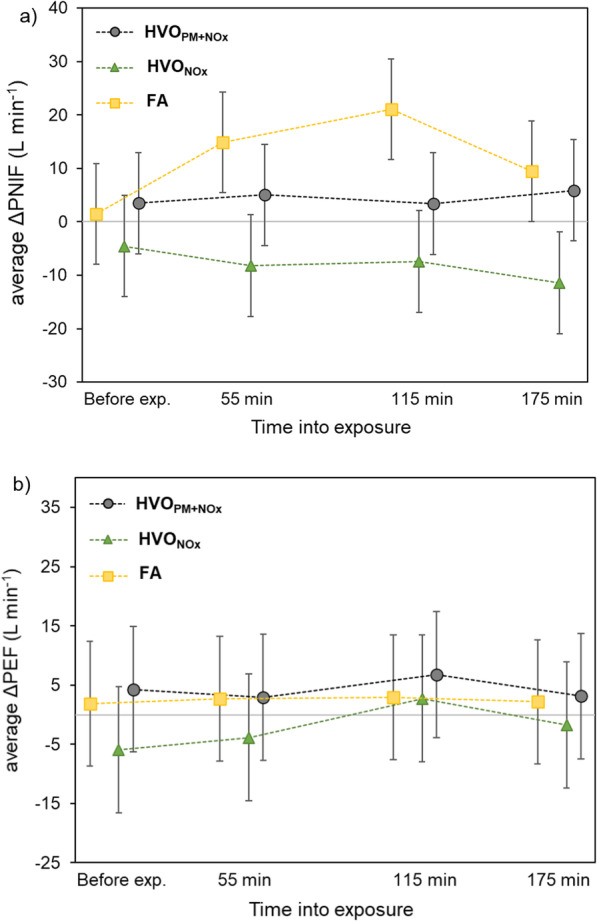
Fig. 4.

The average changes (exposure order corrected) in a PNIF, and b PEF (L/min) during the exposures compared to the measurement before exposure. The change in PNIF and PEF from before exposure (ΔPNIF, ΔPEF) are estimated from linear mixed model after adjusting for exposure order. The measurements for all exposures are made at exactly the same time points (i.e., before exposures and at 55, 115, and 175 min into the exposure). The visible shift on the graph between exposures was applied to clearly show the values. The error bars represent the 95% confidence interval (CI)
