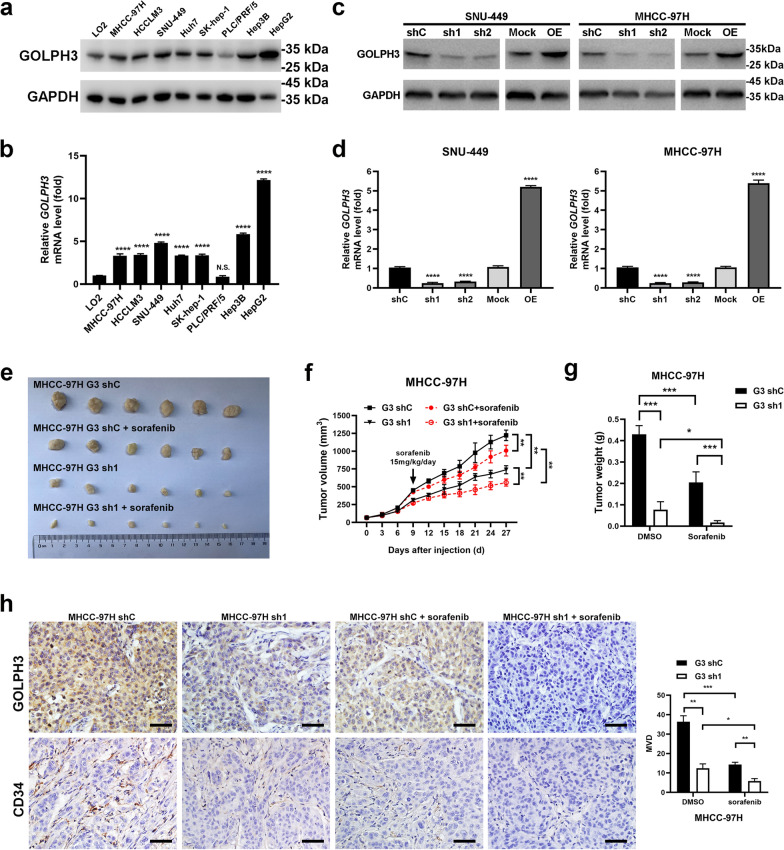
Fig. 1.
GOLPH3 downregulation suppresses angiogenesis and increases resistance of HCC cells to sorafenib in vivo. a, b Western blotting and quantitative RT-PCR (qRT-PCR) assay of GOLPH3 expression in LO2 and 8 HCC cell lines. GAPDH was used as a loading control. c, d Upregulation and downregulation of GOLPH3 in SNU-449 and MHCC-97H cells as confirmed by WB and qRT-PCR assay. GAPDH was used as a loading control. e MHCC-97H-shC and MHCC-97H-sh1 cells (1 × 10⁷) were injected subcutaneously into the flanks of nude mice. Mice were intraperitoneally administered with sorafenib or DMSO from day 9 after administration of cells. f Tumor volume was determined after every 3 days for all groups and presented as growth curves. g Tumor weight was determined and compared for all groups. h Immunohistochemistry staining assay of GOLPH3 and CD34 expression in tumors from 2 mice in each group. Number of MVD was calculated from five random fields. Data are expressed as mean ± SD and analyzed by one-way ANOVA with Dunnett’s multiple comparisons test (b, d) or two-way ANOVA with Tukey’s multiple comparisons test (f–h). *p < 0.05; **p < 0.01; ***p < 0.001; ****p < 0.0001; NS not significant

