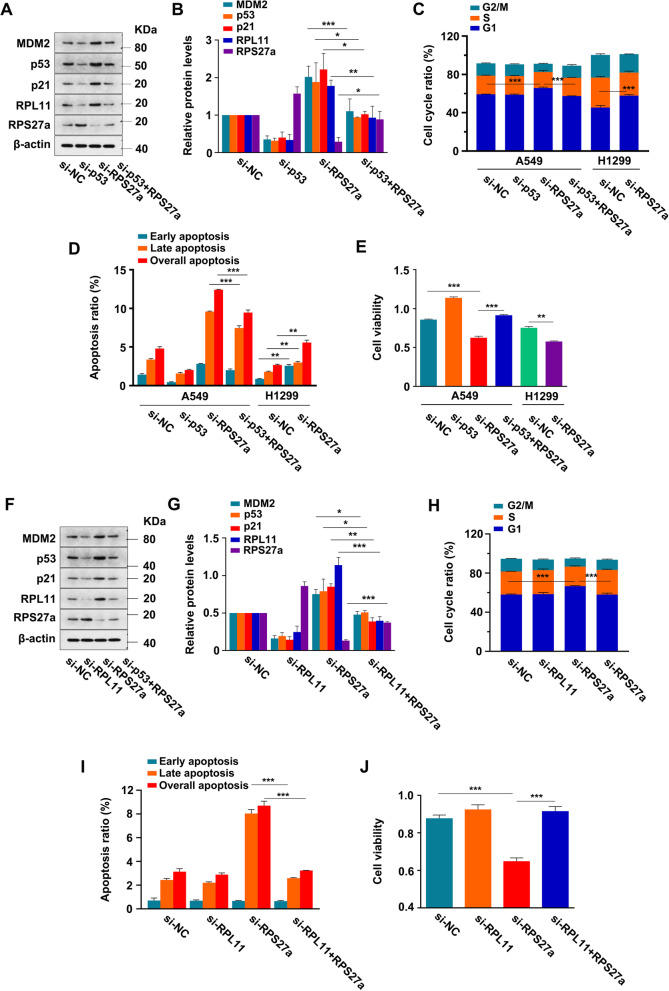
Fig. 3.
Knockdown of RPS27a induces p53-dependent cell cycle arrest and RPL11-dependent p53 activation in A549 cells. A-E A549 cells were co-transfected with p53 and RPS27a-siRNA, and H1299 cells were transfected with RPS27a-siRNA. The expression of proteins was detected with IB (A). The expression of proteins was quantified (target protein/β-actin), and the normalized target protein in NC cells was set at 1.0. *p < 0.05, **p < 0.01 and ***p < 0.001 were calculated with the t-test between co-transfected cells and cells transfected with RPS27a-siRNA alone (n = 3) (B). The cell cycle percentages were analyzed with flow cytometry. **p < 0.01, **p < 0.001 were calculated with ANOVA in A549 cells (n = 3). **p < 0.01 was calculated with the t-test in H1299 cells (n = 3) (C). The percentage of cell apoptosis was analyzed with flow cytometry. ***p < 0.001 was calculated with the t-test between co-transfected cells and cells transfected with RPS27a-siRNA alone (n = 3). **p < 0.01 was calculated with the t-test in H1299 cells (n = 3) (D). The cell viability was measured with CCK-8 assays. ***p < 0.001 was calculated with ANOVA in A549 cells (n = 5). **p < 0.01 was calculated with the t-test in H1299 cells (n = 5) (E). F-J A549 cells were co-transfected with RPL11 and RPS27a-siRNA. The expression of proteins was quantified (target protein/β-actin), and the normalized target protein in NC cells was set at 1.0 (n = 3). *p < 0.05, **p < 0.01 and ***p < 0.001 were calculated with t-test between co-transfected cells and cells transfected with RPS27a-siRNA alone (n = 3) (F). The cell cycle percentages were analyzed with flow cytometry. ***p < 0.001 were calculated with ANOVA in A549 cells (n = 3) (G). The percentage of cell apoptosis was analyzed with flow cytometry. ***p < 0.001 was calculated with the t-test between co-transfection and transfected with RPS27a-siRNA alone (n = 3) (H). The cell viability was measured with CCK-8 assays. ***p < 0.001 was calculated with ANOVA in A549 cells (n = 5) (I). NC, negative control; IB, immunoblotting

