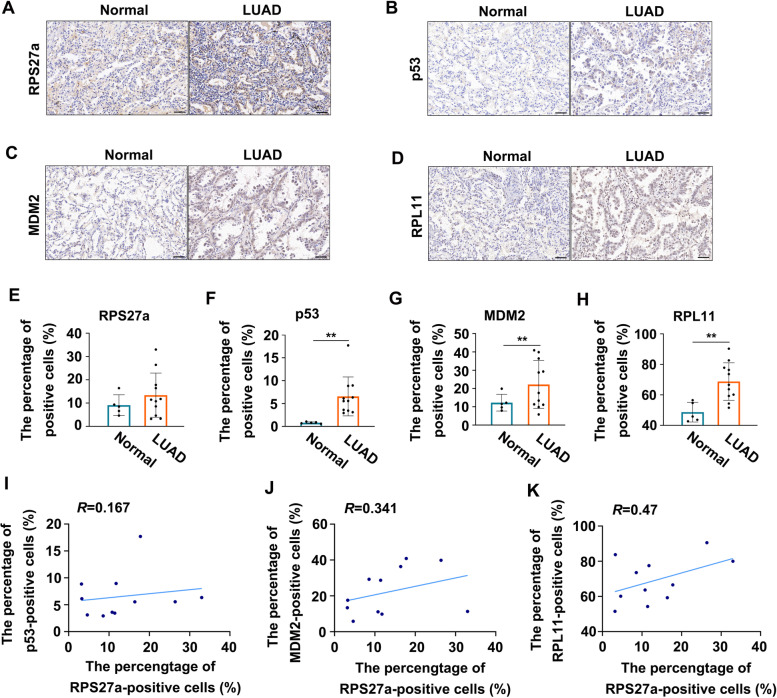
Fig. 7.
The expression and correlation analysis of RPS27a, p53, MDM2 and RPL11 protein in tumor tissues with LUAD. A-D Representative immunohistochemical images of RPS27a, p53, MDM2 and RPL11 in normal lung tissues and tumor tissues with LUAD (magnification, 200×, bar = 50 μm). E-H The percentage of RPS27a, p53, MDM2 and RPL11-positive cells in normal lung tissues and tumor tissues with LUAD. The percentage of positive cells = positive cells counting/total cells counting under 200 magnified visual field was performed with digital image analysis for quantification of proteins, six fields were randomly selected and calculated the average of positive cells in one sample. **p < 0.01 with Student’s t-test analysis. I-K Correlation analysis between RPS27a-positive cells and other proteins in tumor tissues with LUAD (n = 11) were assessed using Pearson’s correlation coefficient. LUAD, lung adenocarcinoma

