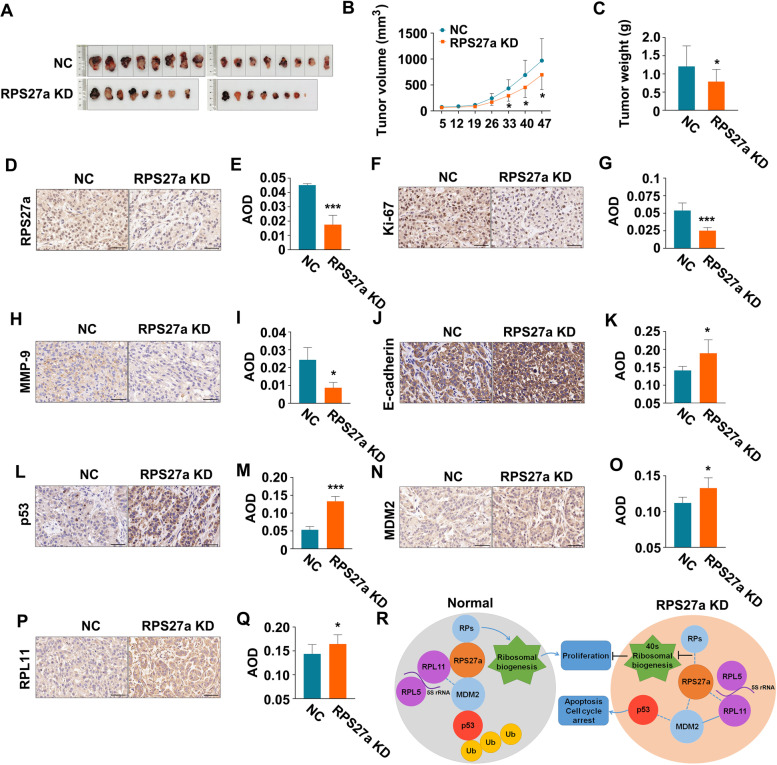
Fig. 8.
Knockdown of RPS27a activates p53 and inhibits the formation of A549 cell xenografts. A Images of tumors with sh-RPS27a or control cells. The mice were sacrificed 47 days after A549 cell implantation. B Growth curves of subcutaneous xenograft tumors from sh-RPS27a (n = 15) or control (n = 16) cells. Tumor size was calculated every 7 days from 5 days after implantation. Values are expressed as the mean ± SD, *p < 0.05 with t-test analysis. B Images of the tumor weights of sh-RPS27a (n = 15) or control (n = 16) cell xenografts. *p < 0.05 with t-test analysis. D, F, H, J, L, N, P IHC analysis of RPS27a, Ki-67, p53, MMP-9, MDM2, E-cadherin, p53, MDM2 and RPL11 in A549 cell implantation, scale bars = 50 μm (magnification, 400×). E, G, I, K, M, O, Q Average optical density per area (AOD) (Integral optical density/Area) was performed with digital image analysis for quantification of proteins; *p < 0.05 and ***p < 0.001 with t-test analysis (n = 4). R RPS27a knockdown enhanced the binding of RPL11 and MDM2, thereby leading to p53 activation. The dotted lines represent the weakened interaction, the solid lines represent the enhanced interaction. LUAD, lung adenocarcinoma; NC, negative control; KD, knockdown; IHC, immunohistochemistry

