
FIGURE 1.
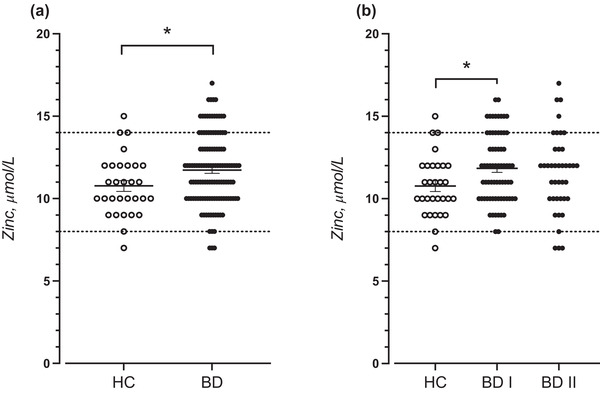
Serum zinc levels in (a) all bipolar disorder patients (BD) and (b) BD I and BD II patients compared with healthy controls (HC). Each data point represents the concentration of a single serum sample in units of μmol/L. Data are shown as mean ± SEM. Data were analyzed using an unpaired t‐tests with equal SD (a); p = .026, or a one‐way ANOVA with Tukey post hoc test (b); p = .035. *p < .05. Both p‐values are two sided. Reference interval for zinc concentration was 8–14 μmol/L