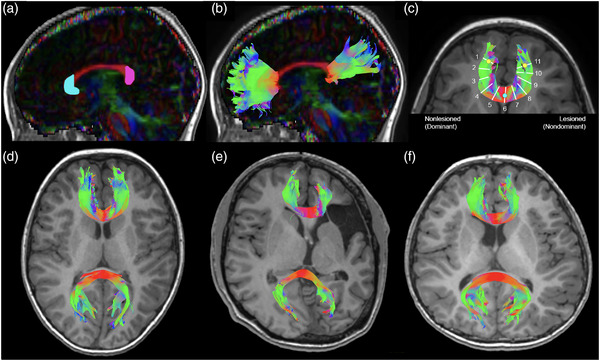
FIGURE 1.

Region of interest placement and resulting representative anterior and posterior forceps tracts. (a) The color‐coded fractional anisotropy map was overlaid on the T1W anatomical image and a sagittal slice was selected at the midline where the corpus callosum is seen in full profile (red). Two regions of interest were drawn on the hooks of the genu (cyan) and splenium (magenta). (b) Resulting sagittal view of the reconstructed anterior and posterior forceps. (c) White matter metrics were measured from 11 tract samples along the anterior forceps along an arc defined using two anterior points (yellow circles) and one midline point (cyan circle). Representative tracts shown for a (d) controls, (e) AIS, and (f) PVI participant. Tract colors represent plane of projection. AIS, arterial ischemic stroke; PVI, periventricular venous infarction
