
FIGURE 1.
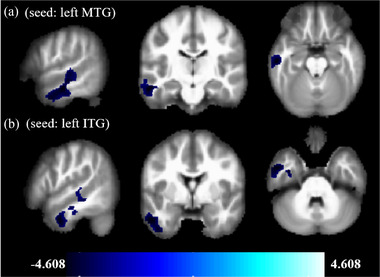
The differences between the gray matter volume of KOA patients and HCs based on voxel‐based morphometry analysis. Brain regions with significantly decreased gray matter as indicated by the t‐statistic (blue). Corrections for multiple comparisons were applied (cluster‐level extent = 255 voxels, p < .001, AlphaSim correction, p < .05, two tailed). KOA, knee osteoarthritis; HCs, healthy controls