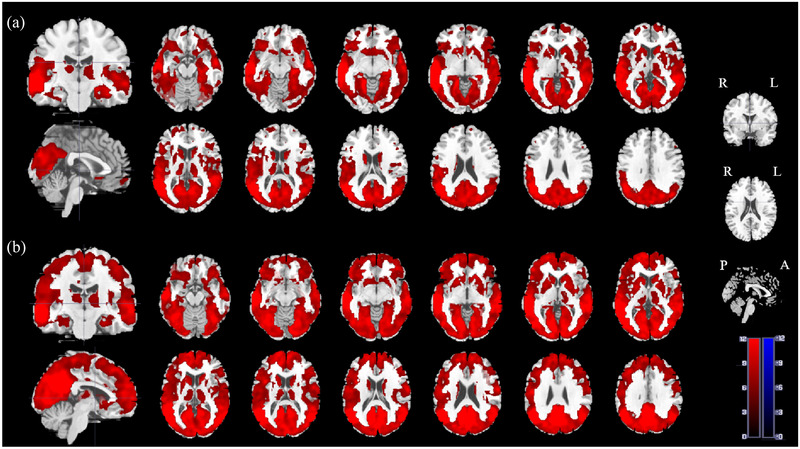
FIGURE 2.

Red represents the area that shows positive connectivity with the left‐MTG.(a) One‐sample t‐test results on connectivity between the left‐MTG and other brain regions in KOA patients. (b) One‐sample t‐test results on connectivity between the left‐MTG and other brain regions in HCs. KOA, knee osteoarthritis; HCs, healthy controls
