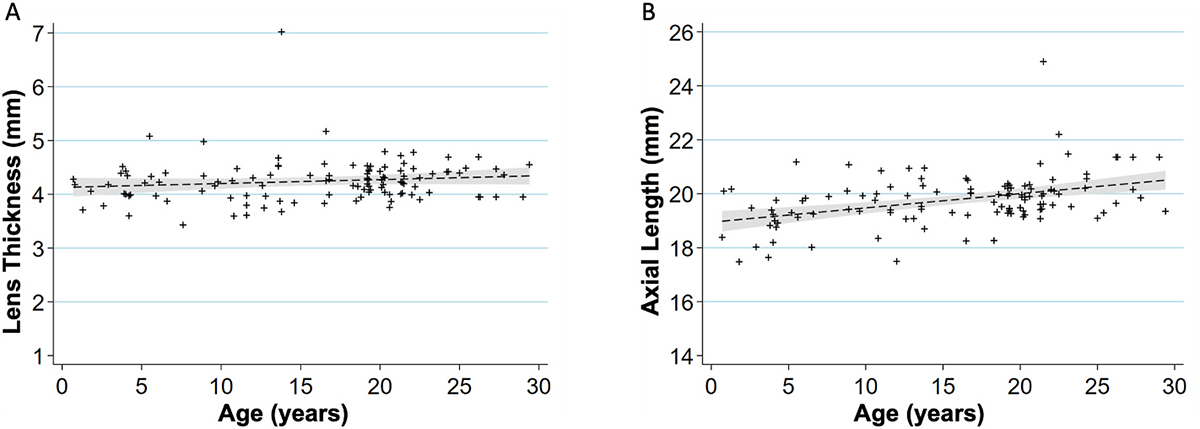
Fig. 2.

Age-related changes in ocular biometry.
(A) Scatterplot showing relationship between age (years) and lens thickness (mm) (n = 114 primates, 228 eyes). The lens thickness increases 7.3 μm per increase in year of age (P = 0.162). A linear regression line that has been fitted with a 95% confidence interval is shown in the grey area of each graph.
(B) Scatterplot showing relationship between age (years) and axial length (mm) (n = 114 primates, 228 eyes). The axial length increases 52.8 μm per increase in year of age (P < 0.001). A linear regression line that has been fitted with a 95% confidence interval is shown in the grey area of each graph.
