Fig. 7.

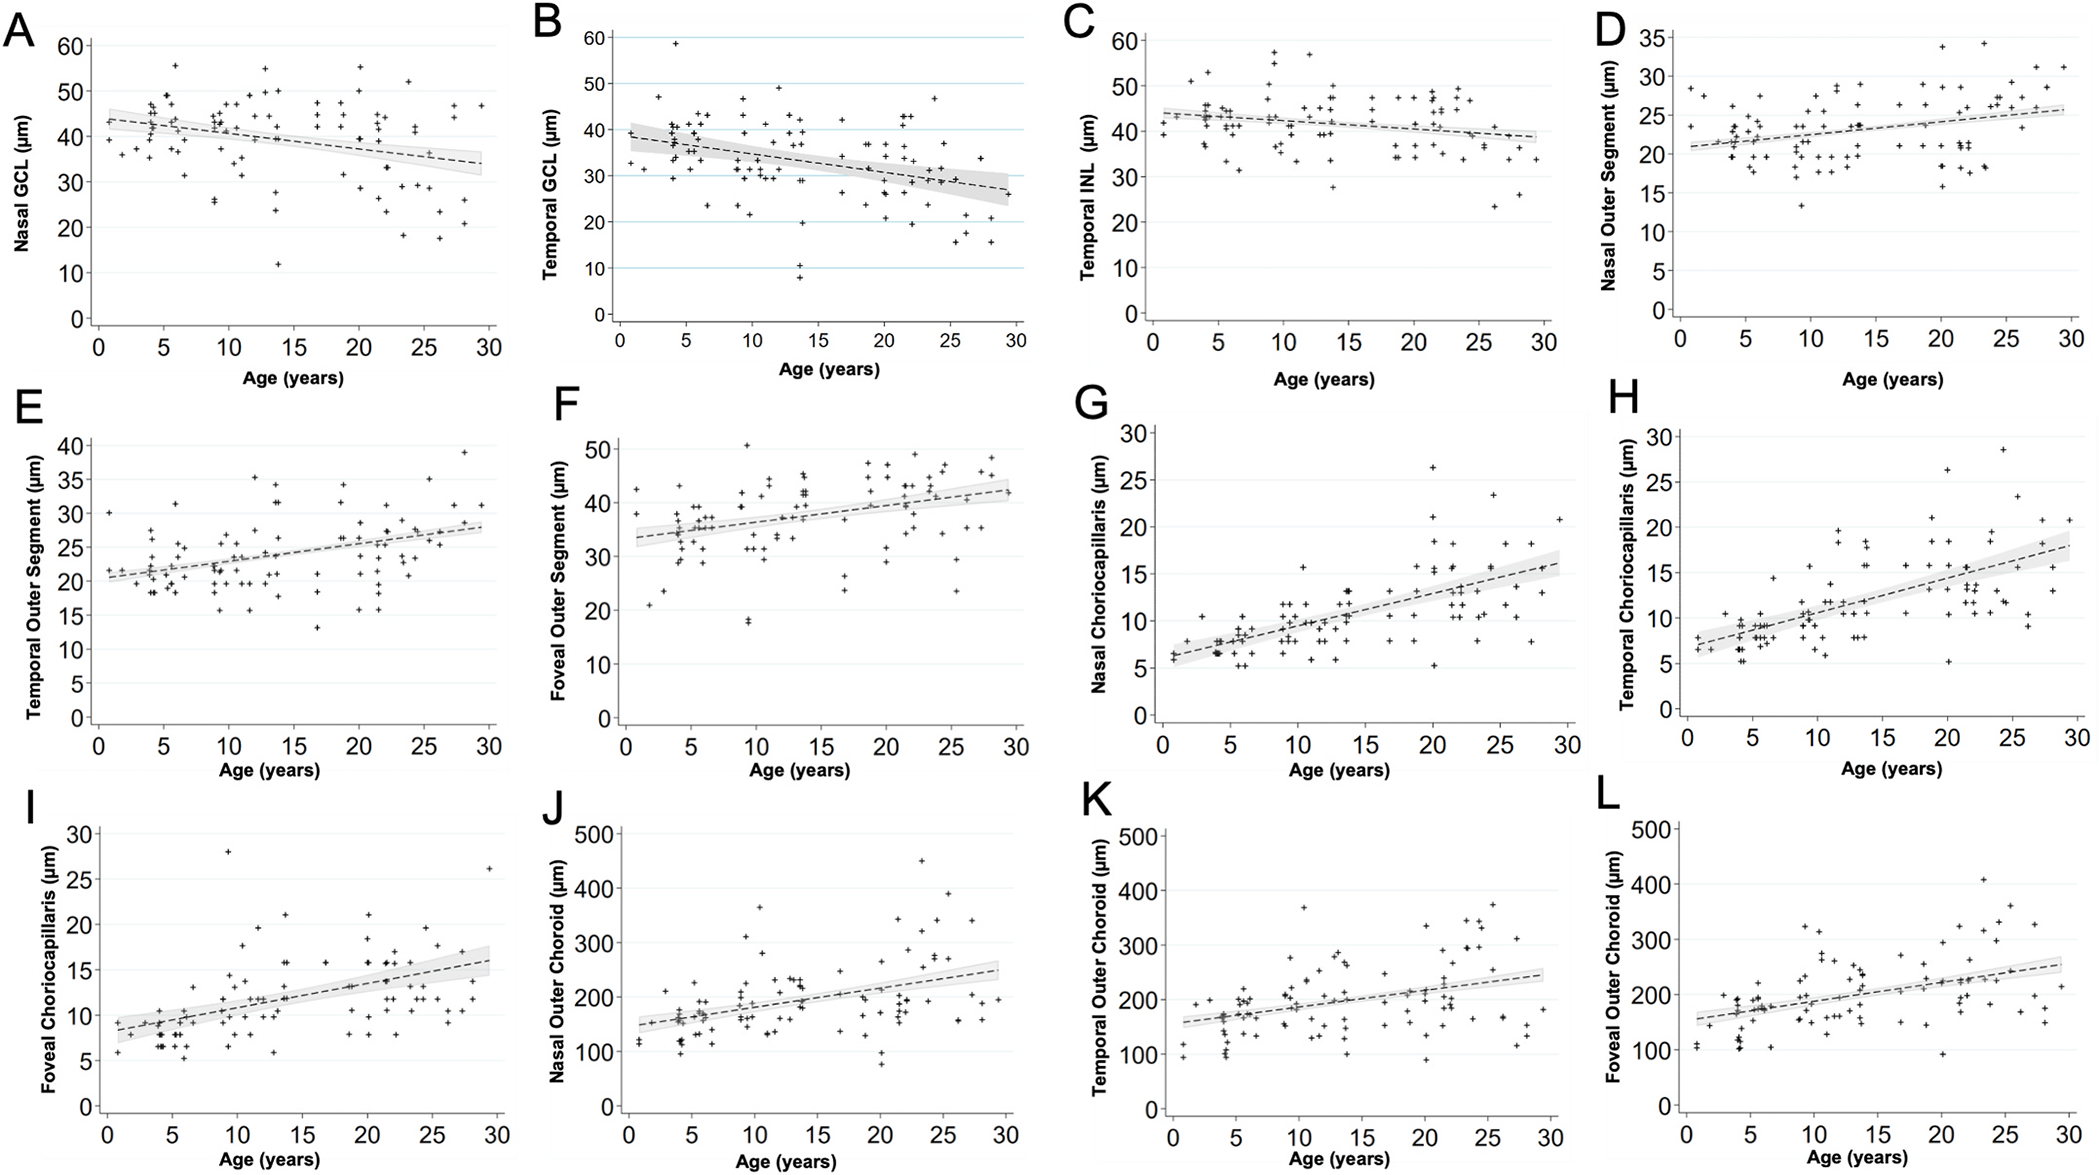
Scatterplots show the relationship between age (years) and the thickness of each layer (μm).
(A) Nasal GCL decreased by a factor of 0.30 μm per increase in year of age (P = 0.019).
(B) Temporal GCL decreased by a factor of 0.37 μm per increase in year of age (P = 0.001).
(C) Temporal INL decreased by a factor of 0.19 μm per increase in year of age (P = 0.025).
(D) Nasal POS increased by a factor of 0.16 μm per increase in year of age (P = 0.003).
(E) Temporal POS increased by a factor of 0.26 μm per increase in year of age (P < 0.001).
(F) Foveal POS increased by a factor of 0.36 μm per increase in year of age (P < 0.001).
(G) Nasal CC increased by a factor of 0.34 μm per increase in year of age (P < 0.001).
(H) Temporal CC increased by a factor of 0.38 μm per increase in year of age (P < 0.001).
(I) Foveal CC increased by a factor of 0.27 μm per increase in year of age (P < 0.001).
(J) Nasal OC increased by a factor of 3.66 μm per increase in year of age (P < 0.001).
(K) Temporal OC increased by a factor of 3.20 μm per increase in year of age (P < 0.001).
(L) Foveal OC increased by a factor of 3.58 μm per increase in year of age (P < 0.001).
