
Fig. 8.
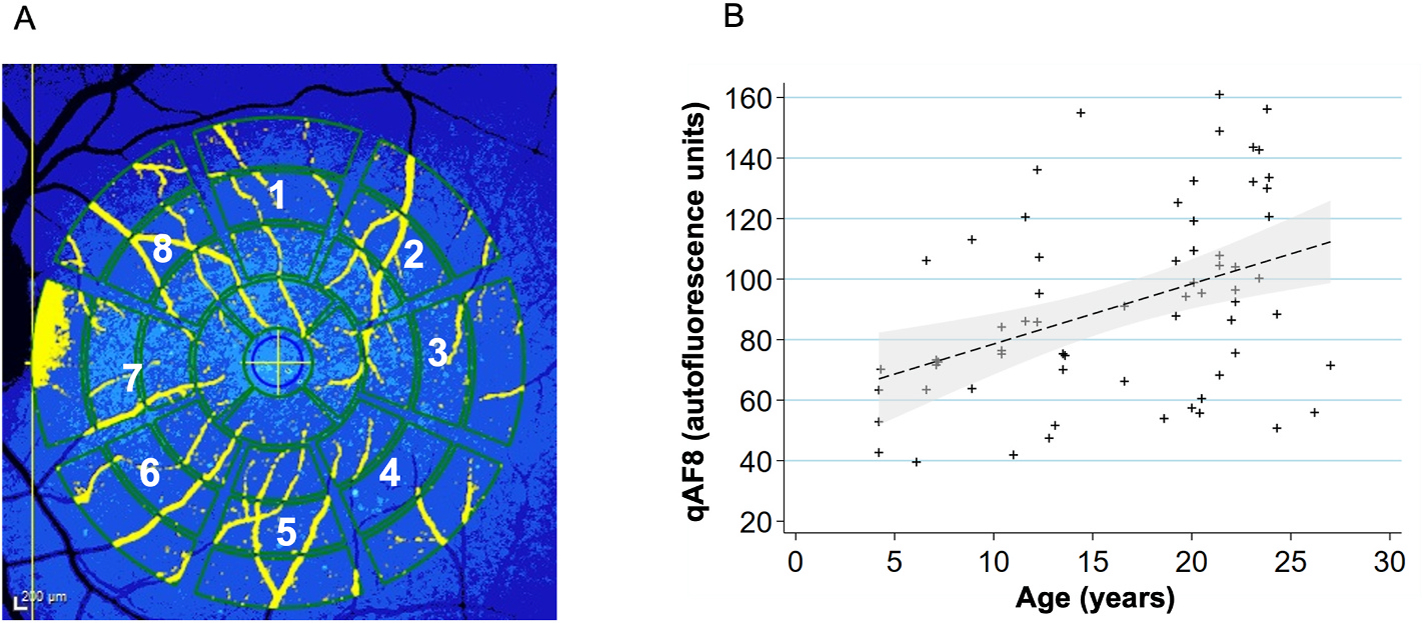
Quantitative autofluorescence analysis (n = 44 primates, 66 eyes).
(A) To acquire qAF8, the eight middle segments (numbered octants) of the perifoveal Delori grid was used in Heidelberg’s qAF mode. The center circle is placed over the foveal center and the grid is expanded until it touches the tangential edge of the optic nerve. Vessels are automatically excluded and the qAF measurements in each octant are normalized to the internal autofluorescence standard shown in the blue bar at the top of the image.
(B) Scatterplot showing relationship between qAF8 and age (years). Mean (standard deviation): 91.4 (31.3). The mean qAF8 increased by a factor of 1.021 autofluorescence units per increase in year of age (P = 0.006). A linear regression line has been fitted with a 95% confidence interval in the grey area.