
Figure 2.
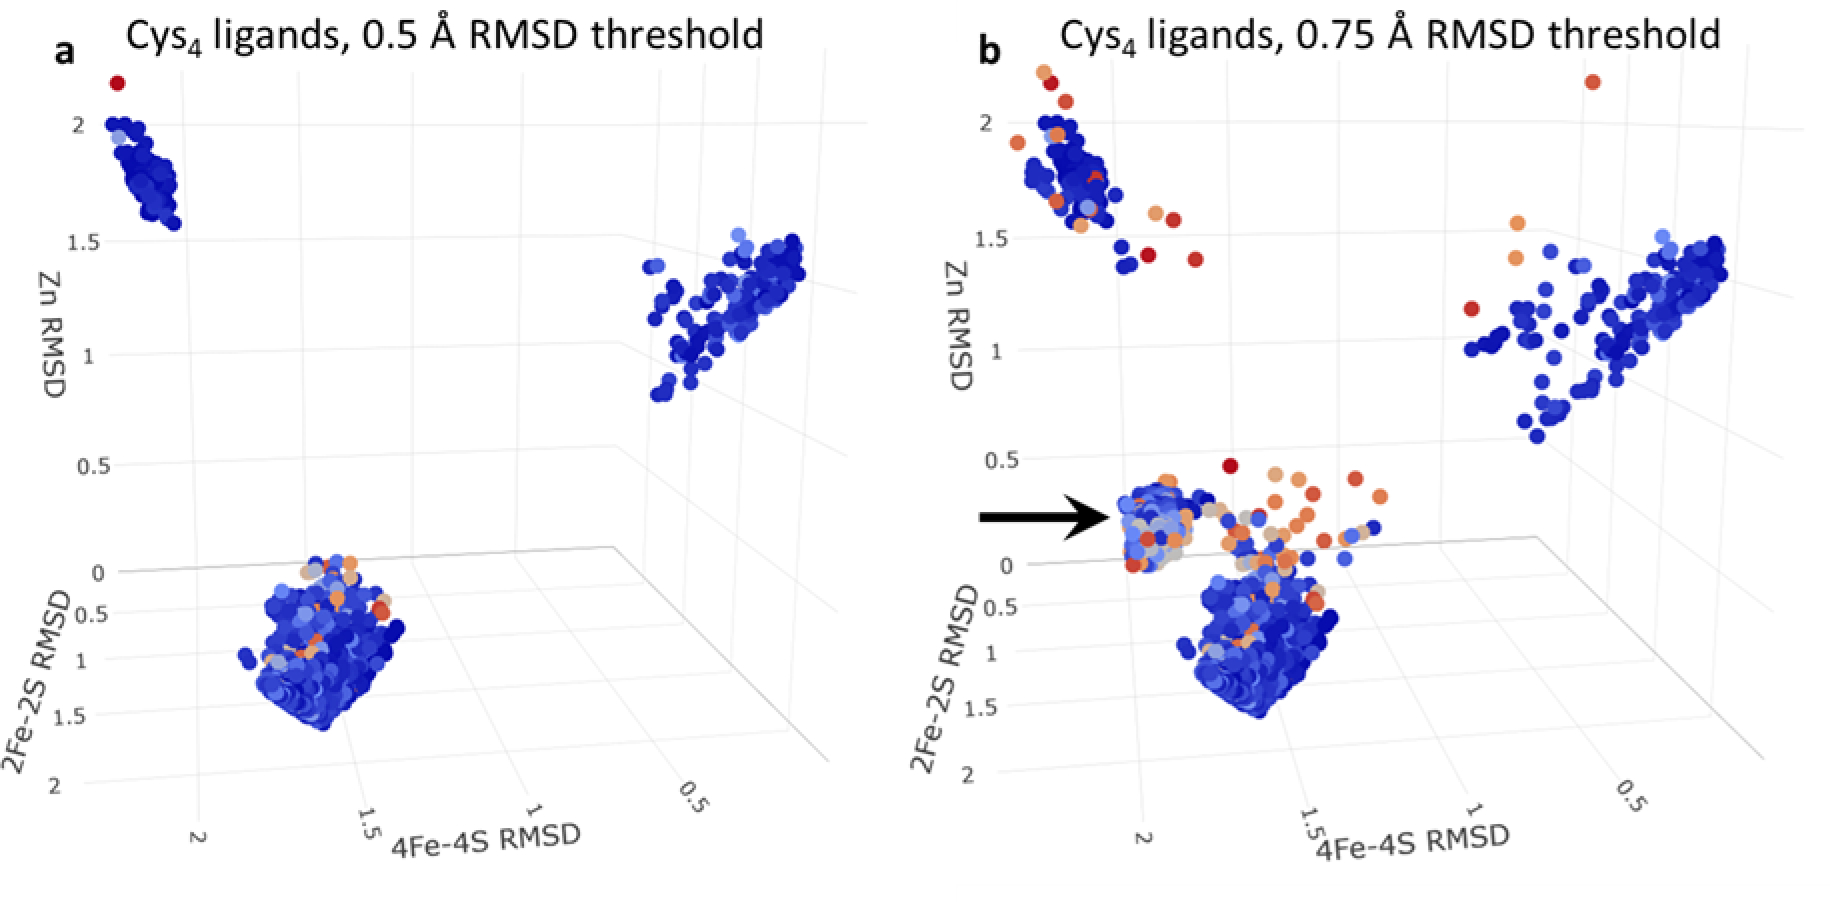
3D scatterplot of the RMSDs of successfully placed ligand types coordinated by 4 cysteine residues. Each point represents a single ligand placed successfully and colored by the minimum pLDDT score of any of its coordinating residues; each axis represents the RMSD of the fit of one of the three possible ligand types (“4Fe-4S Cys4”, “2Fe-2S Cys4”, “Zn Cys4”) on to the coordinating cysteines. (a) shows all ligands that pass an RMSD threshold of 0.5 Å. (b) shows all ligands that pass an RMSD threshold of 0.75 Å. The black arrow highlights the distinct grouping of Zn ligands that appear to contain erroneous disulfide bonds.