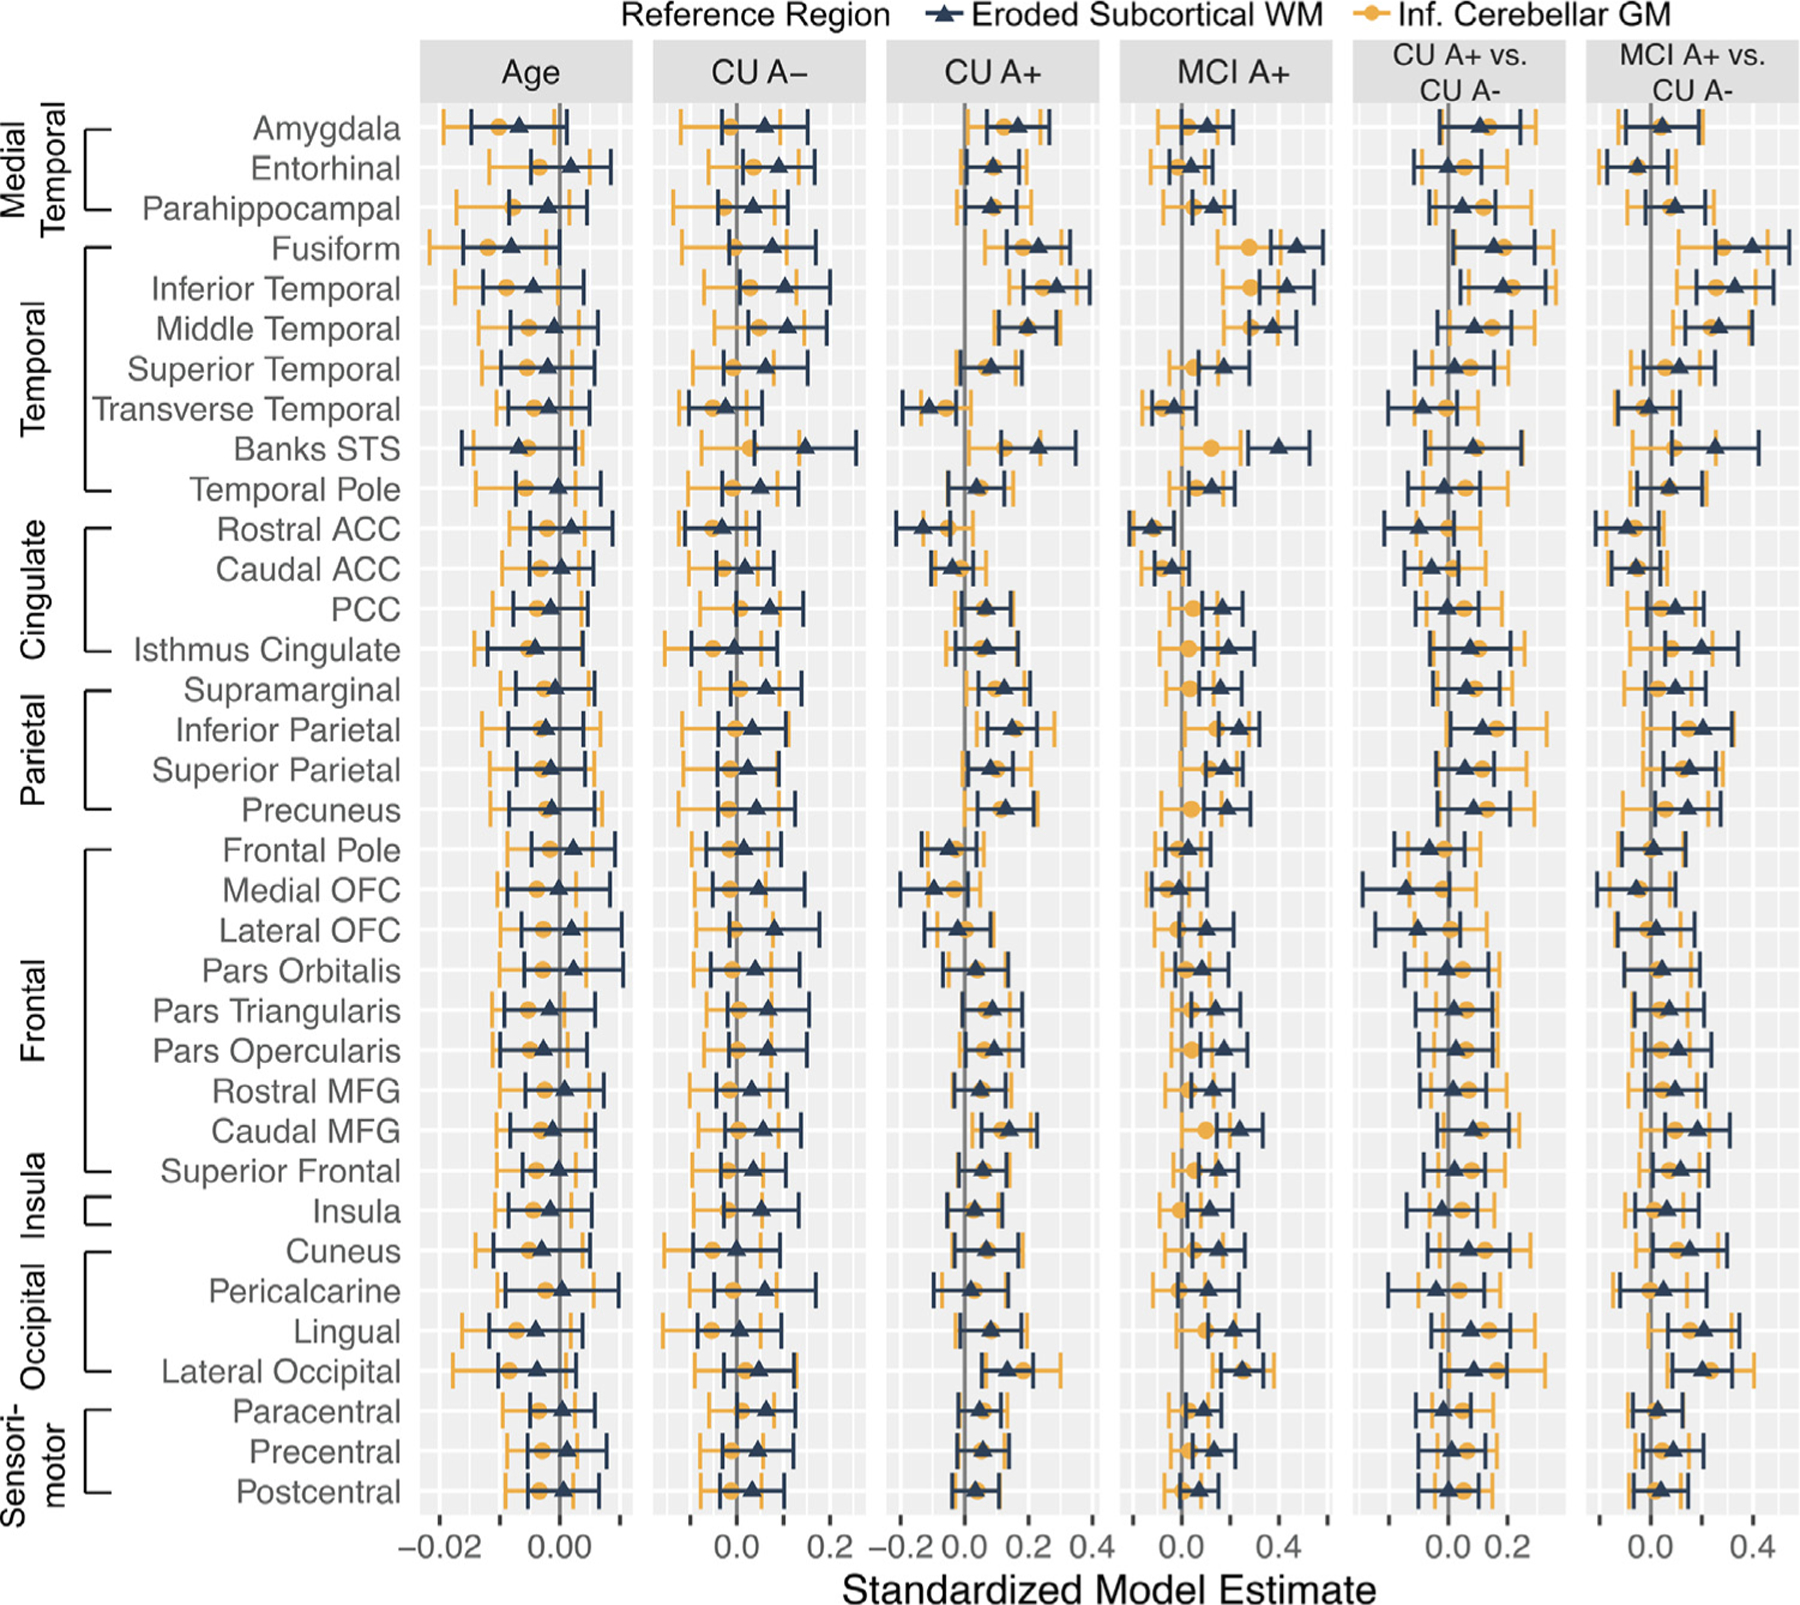
Fig. 6.

Summary of linear mixed model effects of age and group status on longitudinal z-score normalized flortaucipir SUVRs (Z(FTP SUVR)) depending on reference region. The age column reflects the age x time term (i.e., effect of baseline age on change in Z(FTP SUVR) over time). The CU A-, CU A+, and MCI A+ columns reflect the estimated change in Z(FTP SUVR) for each group (i.e., is change in Z(FTP SUVR) different than zero within each group). The CU A+ vs. CU A- and MCI A+ vs. CU A- columns reflect whether change in Z(FTP SUVR) over time differed across groups. Error bars depict a 95% confidence interval.
