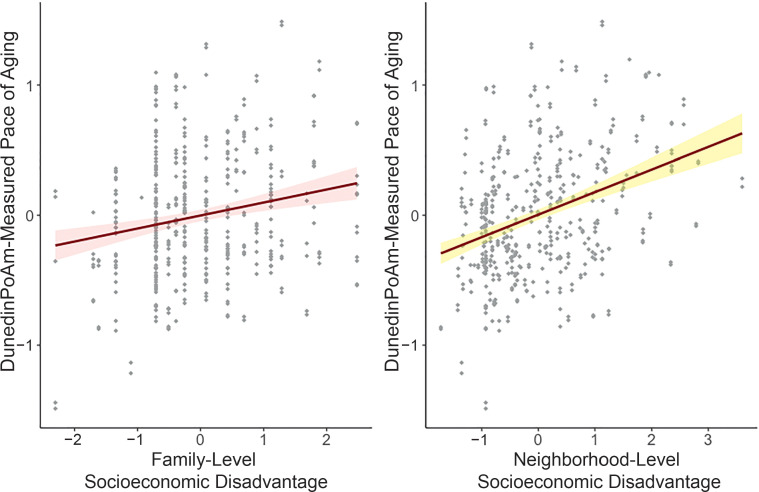
FIGURE 1.
Associations between family- and neighborhood-level socioeconomic disadvantage and DunedinPoAm-measured pace of aging. DunedinPoAm-measured pace of aging and socioeconomic disadvantage values are in SD units. Higher values indicate a methylation profile of faster biological aging. Regression is estimated from a linear mixed-effects model that accounts for nesting of children within families. The shaded areas represent the smoothed lower and upper 95% CIs.

