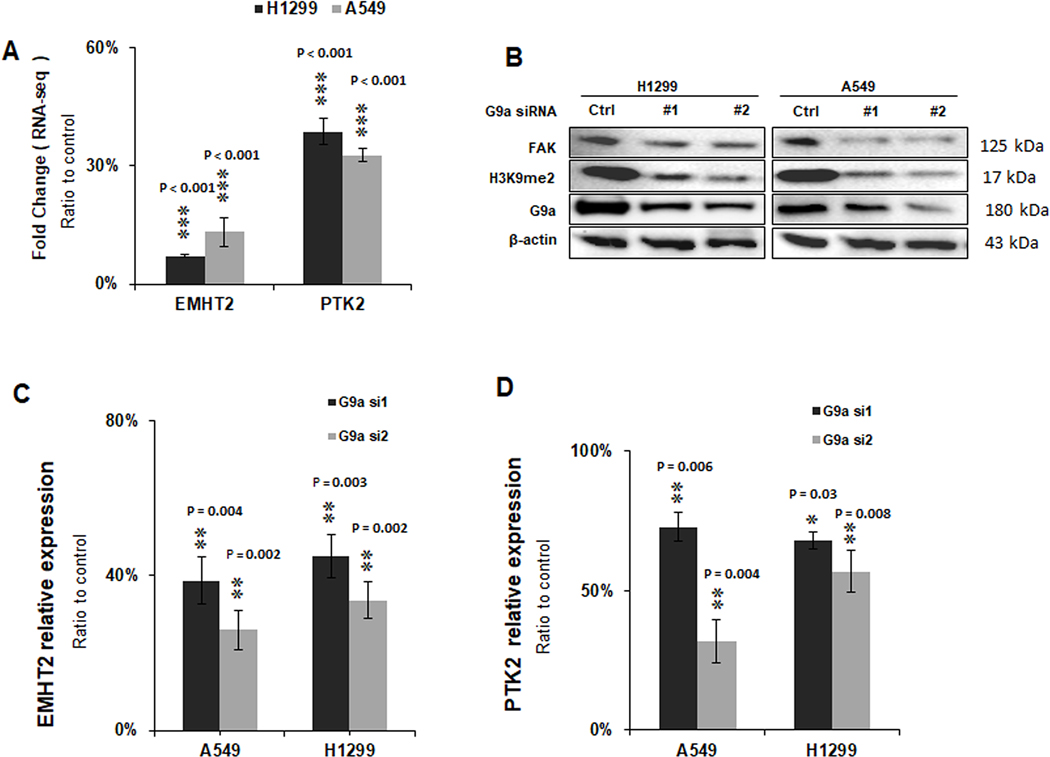
Figure 1. G9a regulates PTK2 gene expression in NSCLC cells.
A. RNAseq data of mRNA levels of EMHT2 (G9a) gene and PTK2 (FAK) gene in G9a-attenuated A549 and H1299 cells by gene-specific siRNAs. B. Western blot analysis shows H3K9me2 and FAK was decreased upon silence of G9a in A549 and H1299 cells. qRT-PCR analysis of mRNAs. C. EMHT2 gene and D. PTK2 gene in G9a-attenuated A549 and H1299 cells. Data is presented as percentages related to the control cells transfected with scramble siRNAs, and is for averages ± standard division based on data of three independent experiments (** P < 0.01, *** P < 0.001, compared to control cells).

