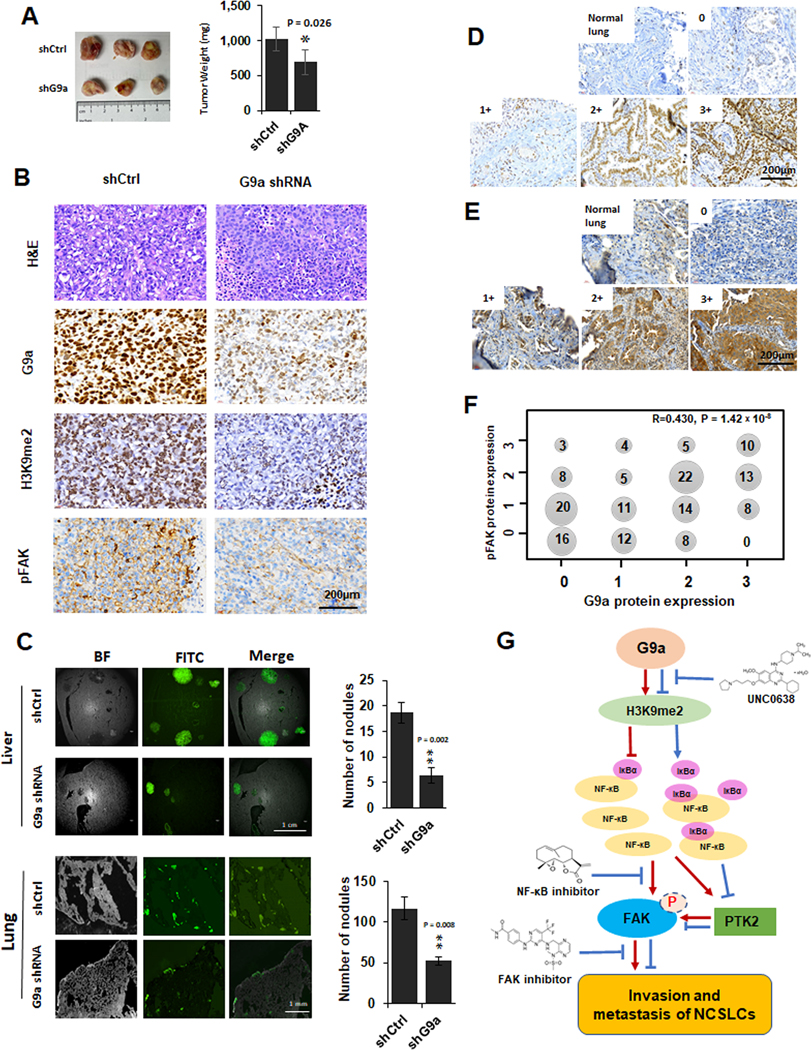
Figure 7. The impact of knockdown of G9a on in vivo growth, metastasis, FAK activation and the correlation of G9a to pFAK proteins in NSCLC tissues.

A. The images (left panel) and weighs (right panel) of xenografts generated by the control cells and G9a-attenuated H1299 (compared to the control xenografts, * P < 0.05. B. Representative images for H&E and G9a, H3K9me2 and pFAK IHC staining in the xenograft tissues of the control and G9a-attenuated H1299 cancer cells (scale bar: 200 μm). C. left panel, Representative GFP images for liver metastasis (the upper of left panel) and lung metastasis (the lower of left panel) formed by the GFP-labeled control and G9a-attenuated H1299 cells. Right panel, Statistical analysis of the metastasized cells and the number of nodules in liver (the upper of right panel) and lung (the right of lower panel) (** P < 0.01, compared to the control cells). D&E. Representative images for G9a (E) proteins and pFAK (F) proteins scored as 0, 1+, 2+, 3+ in NSCLC tissues (Scale bar: 200 μm). F. Cross distribution and correlation of G9a IHC scores to pFAK IHC scores in 159 NSCLC tissues. X axis is for G9a IHC scores, Y axis is for pFAK scores. Number in dot is the sample size with various G9a and pFAK. R is the Spearman’s correlation coefficient for G9a and pFAK. G. Schematic diagram of the potential mechanisms for G9a-enhanced metastasis, modulated FAK and NF-κB signaling pathways, and related therapeutic implications in NSCLC.
