
Figure 5.
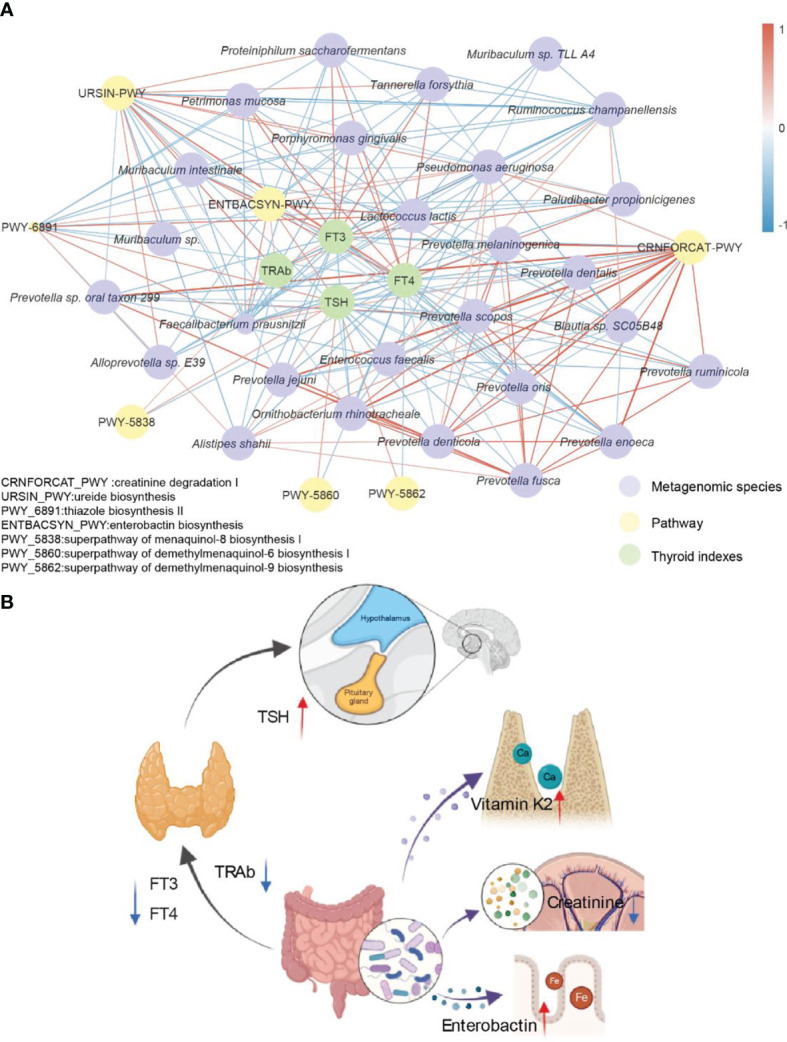
Potential mechanism of interaction between berberine combined with methimidazole and thyroid clinical indexes. (A) Significantly different strains, metabolic pathways and thyroid function indicators are based on Spearman correlation coefficients together to form this correlation network. Edge width and color (positive correlation in red, negative correlation in blue) are proportional to the correlation strength of the co-occurrence probabilities. Node size is proportional to the average abundance of the respective populations. (B) Simplified visualization schematic with possible mechanisms of action including the gut-hypothalamus axis and the gut-thyroid axis.