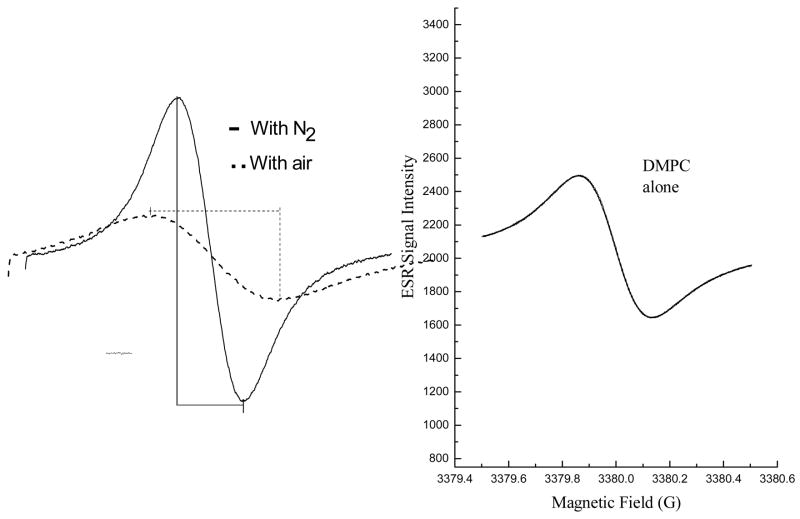
Fig. 7. Effect of fullerene derivatives on lipid peroxidation in liposomes.
Fig. 7A. Oxygen consumption is measured in a closed chamber using liposome suspensions and the spin label 15N-Tempone mixed with a free radical initiator such as AAPH. The left panel shows ESR spectra of the scans of the low field line of 15N-Tempone in a nitrogen atmosphere (solid line) or air-saturated (broken line) aqueous solutions. The presence of oxygen results in a broader and less intense ESR signal for the spin probe. Lipid peroxidation was measured in the control experiment (left panel) with saturated lipid, DMPC, where there is no oxygen consumption because no lipid peroxidation involved. Spectra were recorded at 37°C; 0.5 mW microwave power, 0.05 G modulation amplitude, and 1 G scanning range.
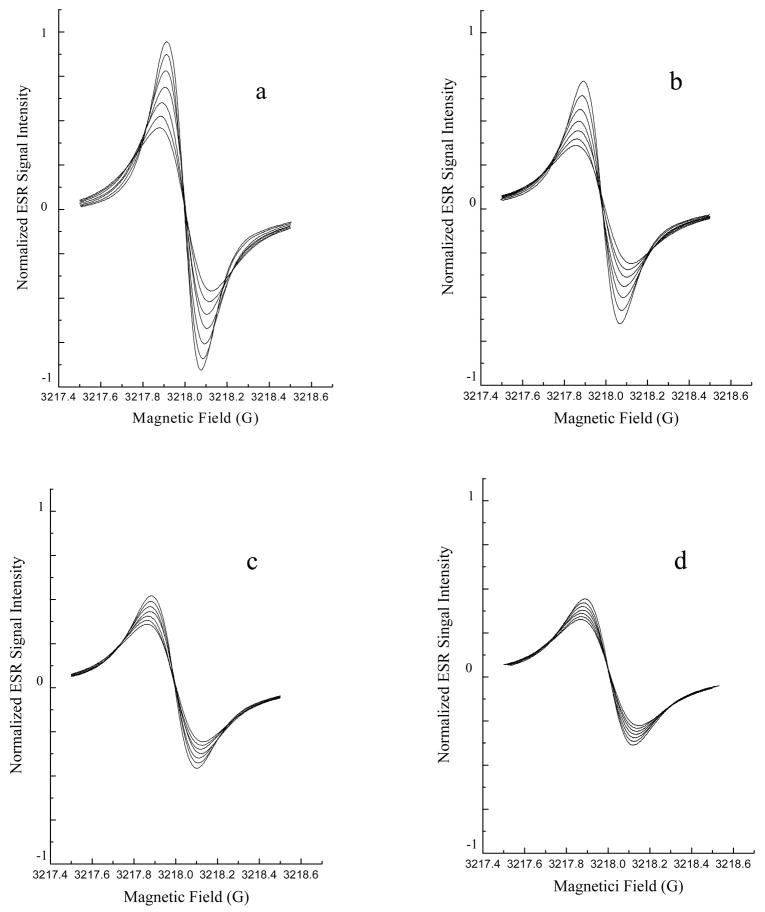
Fig. 7B. Lipid peroxidation was inhibited by fullerene nanoparticles.
Lipid peroxidation was assessed using ESR oximetry. The samples contained liposomes (30 mg/mL egg phosphatidylcholine) and 0.1 mM 15N-Tempone (PD) spin label. Fullerene nanoparticles were also added to some samples (Panel A, no fullerene; Panel B, 300 μM C60(C(COOH)2)2; Panel C, 200 μM C60(OH)20; Panel D 200 μM Gd@C82(OH)22). Lipid peroxidation was initiated by adding 25 mM AAPH. After the sample was sealed in a capillary, the ESR spectrum was recorded 7 times at 4 min intervals with a Varian E-109 X-band spectrometer with a variable temperature controller accessory as described in the Experimental Section. Signals were obtained with 0.5 mW incident microwave power and with 0.05 G field modulation at 37°C. The progressive increases in peak to peak signal intensity (and accompanying progressive narrowing of line width) in each panel are due to time-dependant oxygen consumption resulting from lipid peroxidation. The inhibitory effects of fullerene nanoparticles on lipid peroxidation may be seen as smaller changes in peak to peak signal intensities seen in panels B, C and D compared to panel A.


