. 2022 Jan 24;130(1):017011. doi: 10.1289/EHP9676

Figure 4.

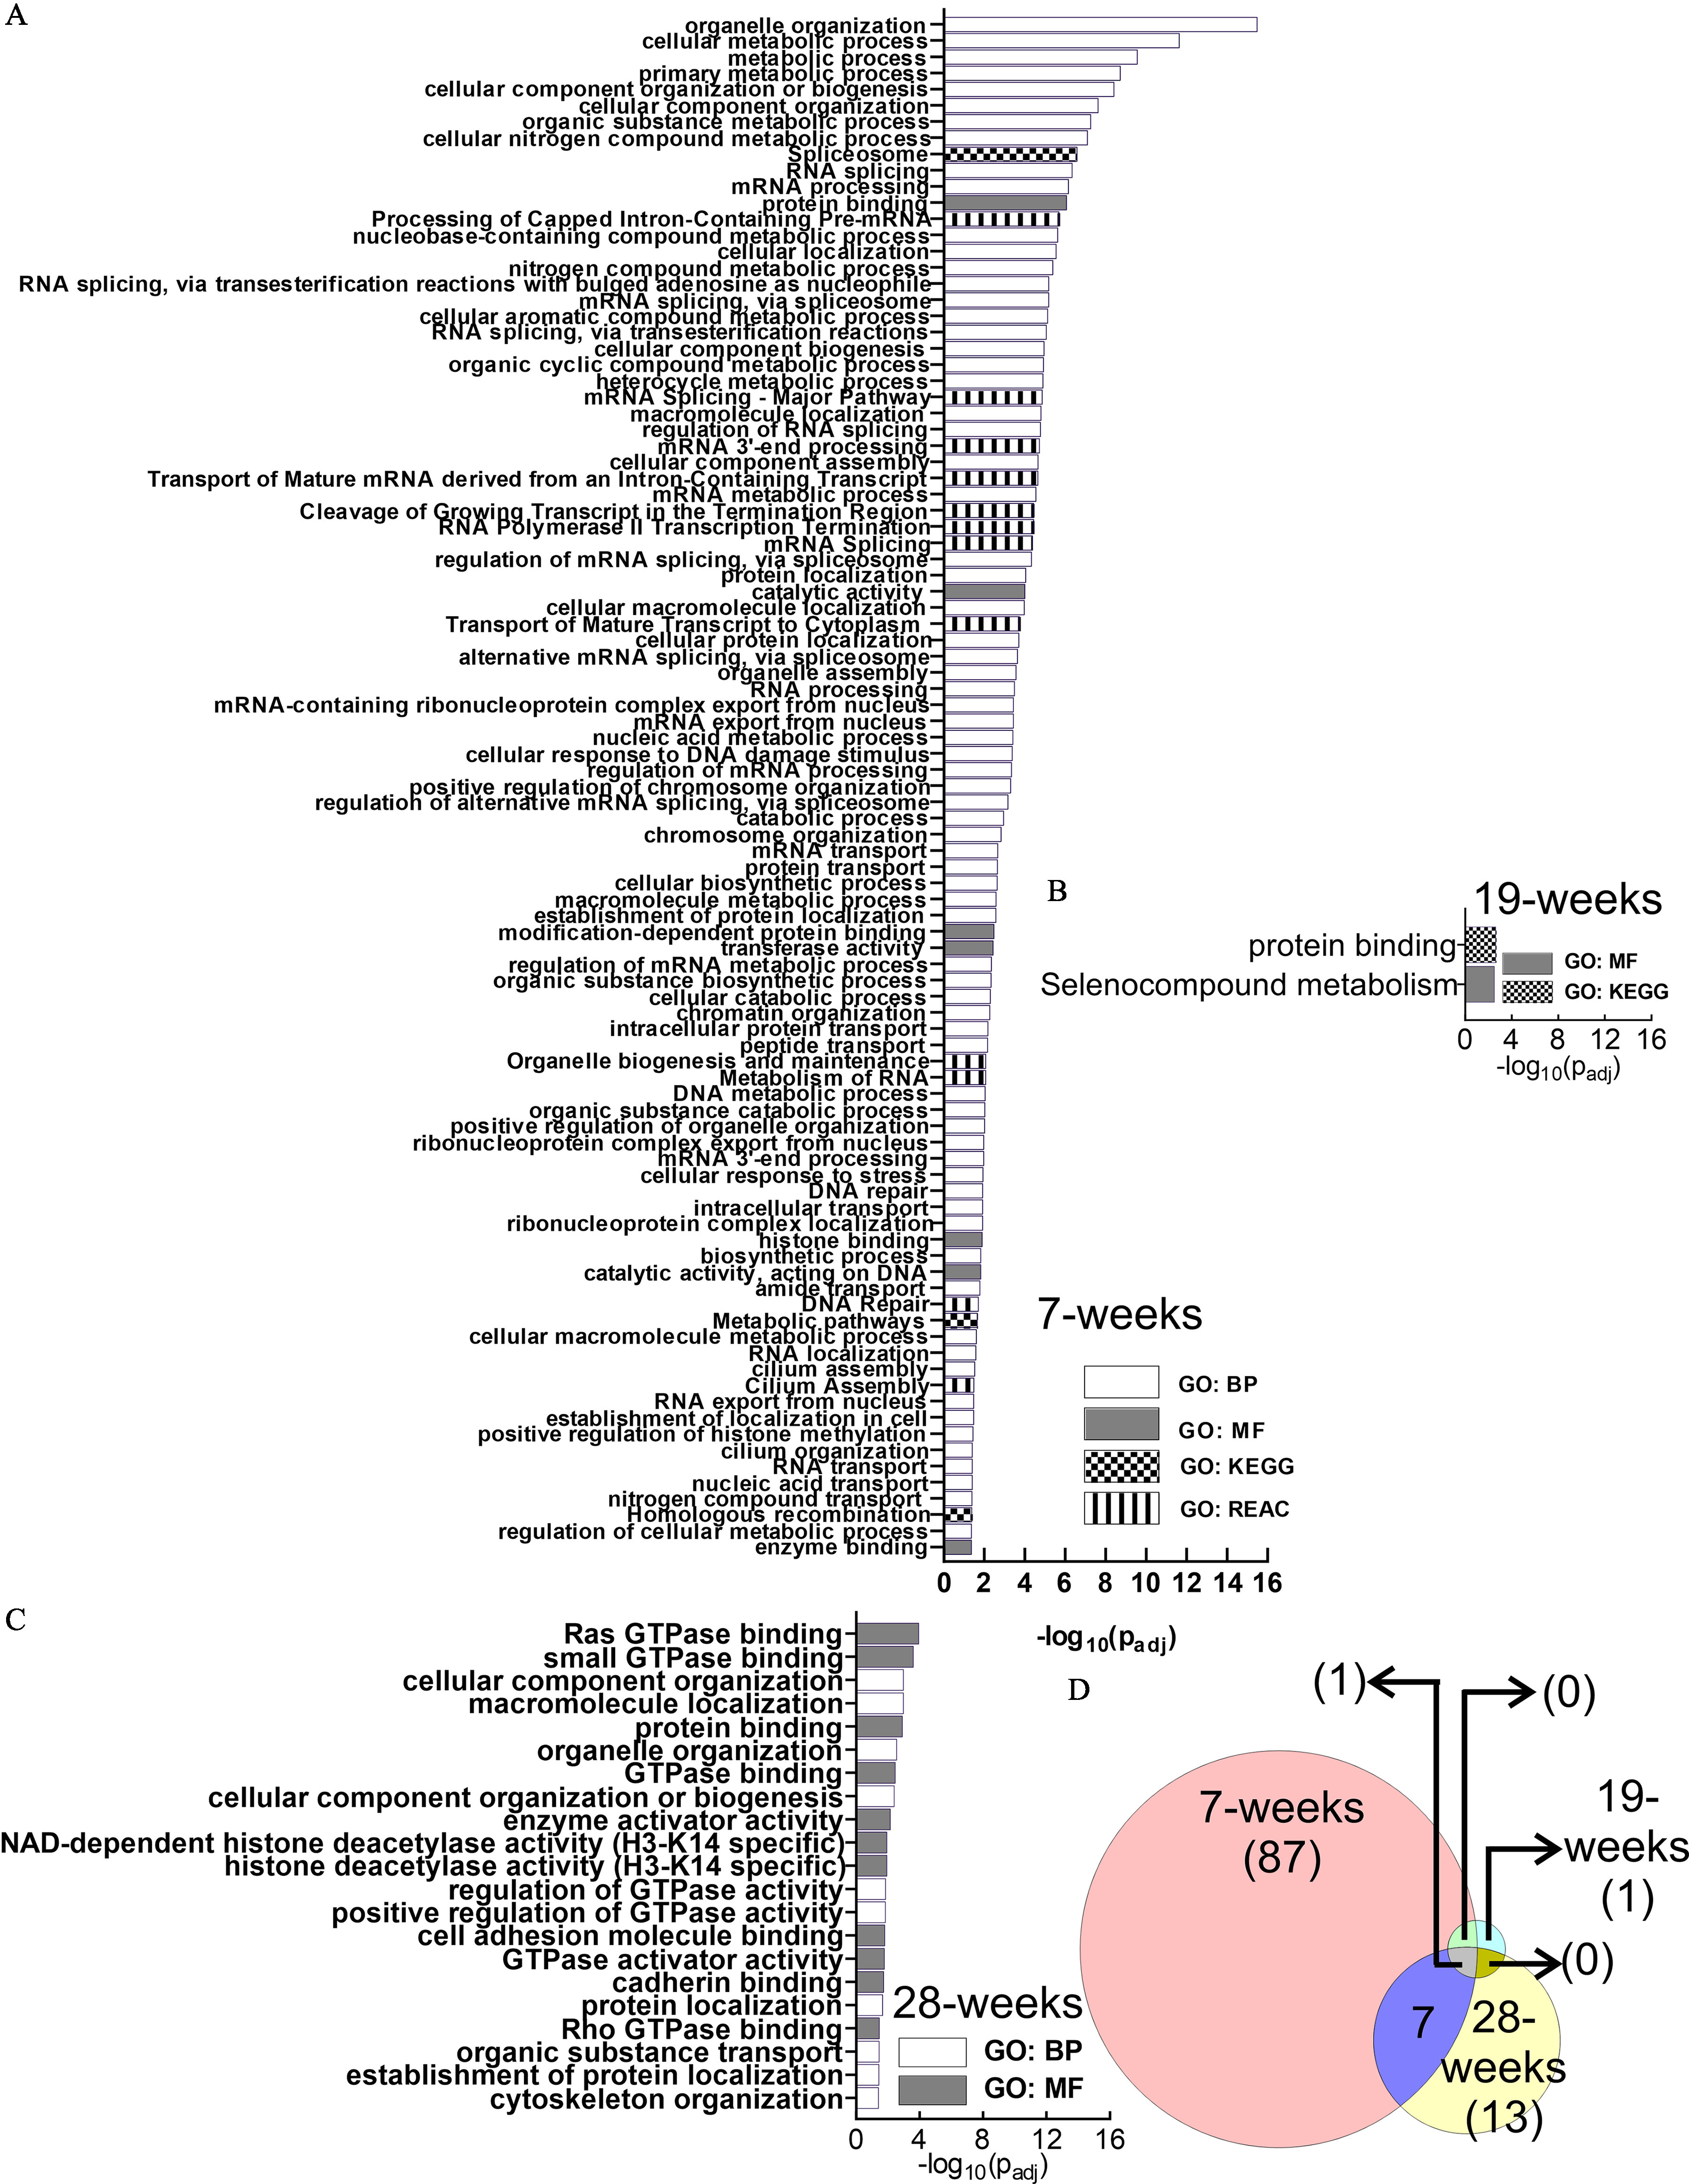
Figure 4A is a horizontal bar graph, plotting organelle organization, cellular metabolic process, metabolic process, primary metabolic process, cellular component organization of biogenesis, cellular nitrogen compound metabolic process, spliceosome, RNA splicing, mRNA processing, protein binding, processing of Capped Intron-containing pre-mRNA, nucleobase containing compound metabolic process, cellular localization, nitrogen compound metabolic process, RNA splicing, via transesterification reactions with bulged adenosine as nucleophile, mRNA splicing, via spliceosome, cellular aromatic compound metabolic process, RNA splicing, via transesterification reactions, cellular compound biogenesis, organic cyclic compound metabolic process, heterocycle metabolic process, mRNA splicing-major pathway, macromolecule localization, regulation of RNA splicing, mRNA 3′ end processing, cellular component assembly, transport of mature mRNA derived from an intron-containing transcript, mRNA metabolic process, cleavage of growing transcript in the termination region, RNA polymerase 2 transcription termination, mRNA splicing, regulation of mRNA splicing, via spliceosome, protein localization, catalytic activity, cellular macromolecule localization, transport of mature transcript to cytoplasm, cellular protein localization, alternative mRNA splicing, via spliceosome, organelle assembly, RNA processing, mRNA-containing ribonucleoprotien complex export from nucleus, mRNA export from nucleus, nucleic acid metabolic process, cellular response to DNA damage stimulus, regulation of mRNA processing, positive regulation of chromosome organization, regulation of alternative mRNA splicing, via spliceosome, catabolic process, chromosome organization, mRNA transport, protein transport, cellular biosynthetic process, marcromolecule metabolic process, establishment of protein localization, modification-dependent protein binding, transferase activity, regulation of mRNA metabolic process, organic substance biosynthetic process, cellular catabolic process, chromatin organization, intracellular protein transport, peptide transport, organelle biogenesis and maintenance, metabolism of RNA, DNA metabolic process, organic substance catabolic process, positive regulation of organelle organization, ribonucleoprotein complex export from nucleus, mRNA 3′ end processing, cellular response to stress, DNA repair, intracellular transport, ribonucleoprotein complex localization, histone binding, biosynthetic process, catalytic activity, acting on DNA, amide transport, DNA repair, metabolic pathways, cellular macromolecule metabolic process, RNA localization, cilium assembly, cilium assembly, RNA export from nucleus, establishment of localization in cell, positive regulation of histone methylation, cilium organization, RNA transport, nucleic acid transport, nitrogen compound transport, homologous recombination, regulation of cellular metabolic process, and enzyme binding (y-axis) across negative log to the base 10 of open parenthesis lowercase p begin subscript adjusted end subscript close parenthesis, ranging from 0 to 16 in increments of 2 (x-axis) for 7 wk, including gene ontology: biological process, gene ontology: molecular function, gene ontology: Kyoto Encyclopedia of Genes and Genomes, and gene ontology: Reactome. Figure 4B is a horizontal stacked bar graph, plotting protein binding and selenocompound metabolism (y-axis) across negative log to the base 10 of open parenthesis lowercase p begin subscript adjusted end subscript close parenthesis, ranging from 0 to 16 in increments of 2 (x-axis) for 19 wk, including gene ontology: molecular function and gene ontology: Kyoto Encyclopedia of Genes and Genomes. Figure 4C is a horizontal bar graph, plotting Ras GTP ase binding, small GTP ase binding, cellular component organization, macromolecule localization, protein binding, organelle organization, GTP ase binding, cellular component organization or biogenesis, enzyme activator activity, NAD-dependent histone deacetylase activity (H 3-K 14 specific), histone deacetylase activity (H 3-K14 specific), regulation of GTP ase activity, positive regulation of GTP ase activity, cell adhesion molecule binding, GTP ase activator activity, cadherin binding, protein localization, Rho GTP ase binding, organic substance transport, establishment of protein localization, and cytoskeleton organization (y-axis) across negative log to the base 10 of open parenthesis lowercase p begin subscript adjusted end subscript close parenthesis, ranging from 0 to 16 in increments of 2 (x-axis) for 28 wk, including gene ontology: biological process and gene ontology: molecular function. Figure 4D is a Venn diagram having three circles. The circle on the left is labeled 7 wk, the circle on the right is labeled 19 wk, the circle at the bottom is labeled 28 weeks. In 7 wk, there are 87 pathways, in 19 wk, there is 1 pathway, and in 28 wk, there are 13 pathways. Between 7 and 19 wk, there are 0 pathways, between 19 to 28 wk, there are 0 pathways, and between 7 to 28 wk, there is 1 pathway. The intersection area has 7 pathways.

GO Functional enrichment analysis of the differential alternative splicing events in HaCaT cells induced by arsenic exposure. (A) 7 wk, (B) 19 wk, and (C) 28 wk. GO terms depicted in (A–C) are presented in the same order as in Excel Table S1 [in ascending order of log10(padj)]. (D) Venn diagram describing the number of enriched pathways at each time point and their overlap at different time points. Note: BP, biological process; GO, gene ontology; GTPase, guanosine triphosphatase; KEGG, Kyoto Encyclopedia of Genes and Genomes; MF, molecular function; REAC, Reactome.