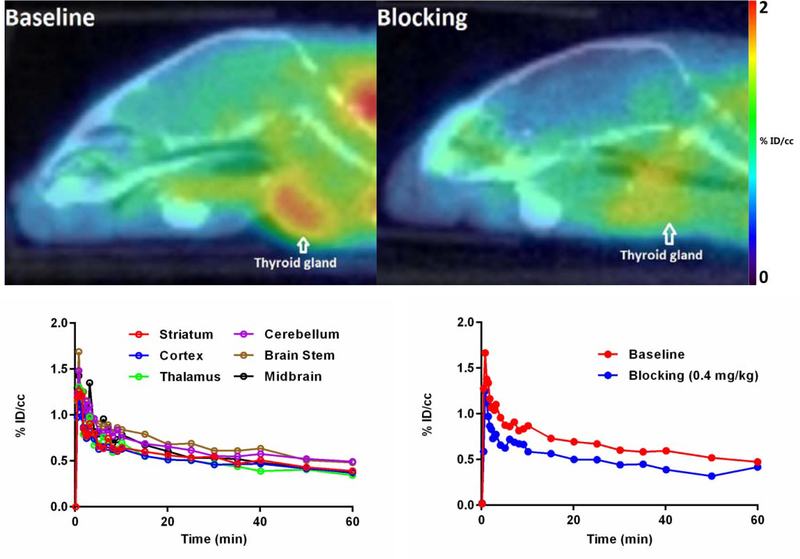
Fig. 4.
Above: Sagittal PET/CT images of [11C]1 in baseline and blocking experiments (summed 15–60 mins). Below (left): Baseline TACs in six representative mouse brain regions. Below (right): TACs of baseline and blocking experiments in C57BL/6 mouse brains. All data are the mean. Data are expressed as the percentage of injected dose per cubic centimetre (% ID/cc).

