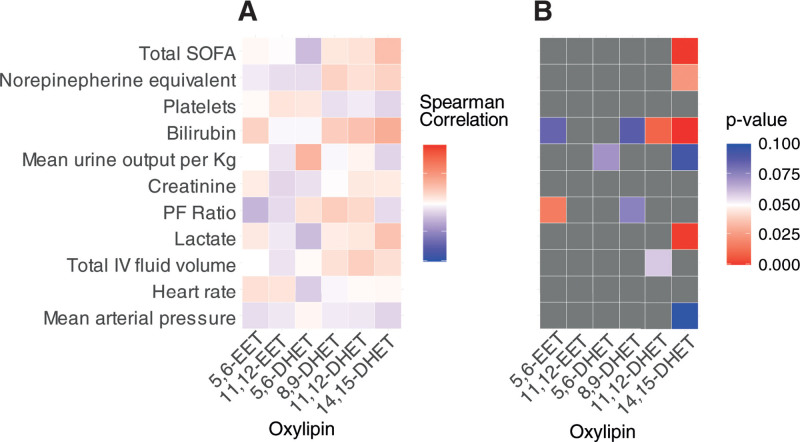
Figure 2.
Correlation between measurable dihydroxyeicosatrienoic acids (DHETs) or their precursor epoxyeicosatrienoic acids (EETs) and daily clinical variables. A, Correlation matrix showing the Spearman rho correlation coefficients for oxylipin concentrations of the DHETs and their precursor EETs where quantities were above the lower limit of quantification. Data combines all sampled time points over the first week of ICU stay and their matched continuous clinical variables. B, Corresponding p value matrix for the correlation coefficients shown in (A), colored boxes represent p < 0.1 and gray boxes are all those greater than 0.1. Significant p values are considered less than 0.05 (red). PF = Pao2:Fio2 ratio, SOFA = Sequential Organ Failure Assessment.

