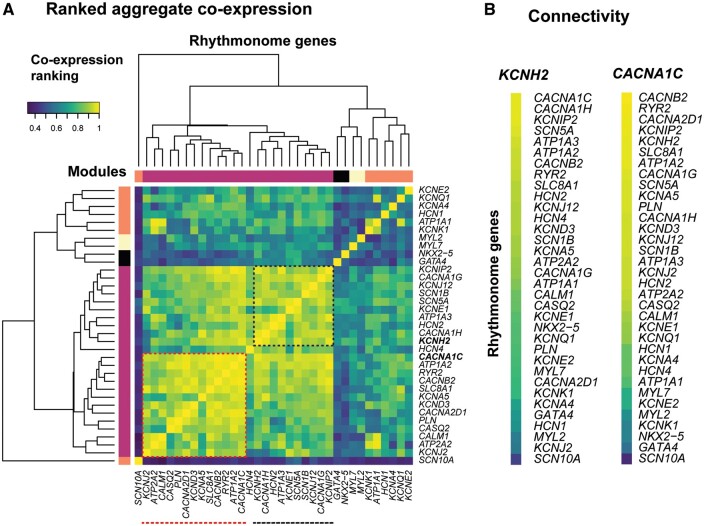
Figure 1.
(A) Sub-network of co-expression ranking across 35 genes encoding for cardiac ion channels or calcium homeostasis proteins. Spearman’s correlation coefficients are colour coded from blue: low-ranked correlations to yellow: high-ranked correlations. The dendrogram illustrates the modules of genes with high levels of similarity in their transcriptional profiles. Red- and black-dashed boxes highlight sub-networks of correlated genes. (B) Connectivity of genes to KCNH2 (encodes for IKr) and CACNA1C (encodes for ICaL). The list of 75 RNA-seq experiments interrogated is summarized in Supplementary material online, Table S2.

