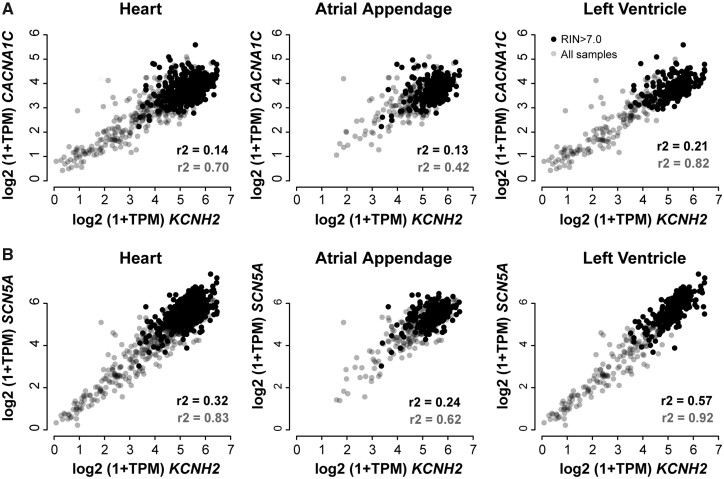
Figure 2.
Expression levels of (A) CACNA1C and (B) SCN5A vs. expression levels of KCNH2 in the GTEx dataset. Expression levels are expressed as log(transcripts per million+1). Data points for samples with a RNA integrity number (RIN) >7.0 are shown in black (237 atria, 235 left ventricle samples) and all other sample data points are shown in grey (192 atria, 197 left ventricle samples). The left panel shows all heart samples, the middle panel shows atrial appendage samples, and the right panel shows left ventricular samples. Correlation coefficients shown in black and grey at the bottom right of each panel correspond to the full dataset (grey) and the samples with a high RIN (black). Correlation coefficients for linear fits to the data are shown in each panel. It is notable that correlations are stronger for the ventricular samples than for atrial samples.

