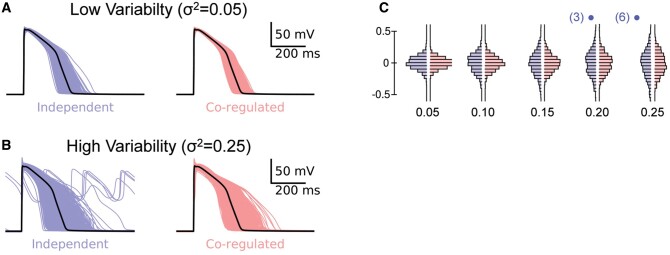
Figure 3.
APs for independent (blue) and co-expression of GKr-GCaL (red) for (A) low scalar variability (σ2=0.05) and (B) high scalar variability (σ2=0.25). Note the presence of EADs in six of the APs in the independent group with σ2=0.25. The last four beats for each of the populations of 1000 APs are shown in the movies in Supplementary material online. (C) Histograms of log(APD90/mean APD90) distributions for co-expressed (red) or independent (blue) GKr-GCaL simulations with σ2=0.05, 0.1, 0.15, 0.2, 0.25. The numbers in parentheses above the 0.2 and 0.25 groups indicate the number of EADs in each independent scalars group. APs and incidence of EADs for an extended range of variances are shown in Supplementary material online, Figure S6.

