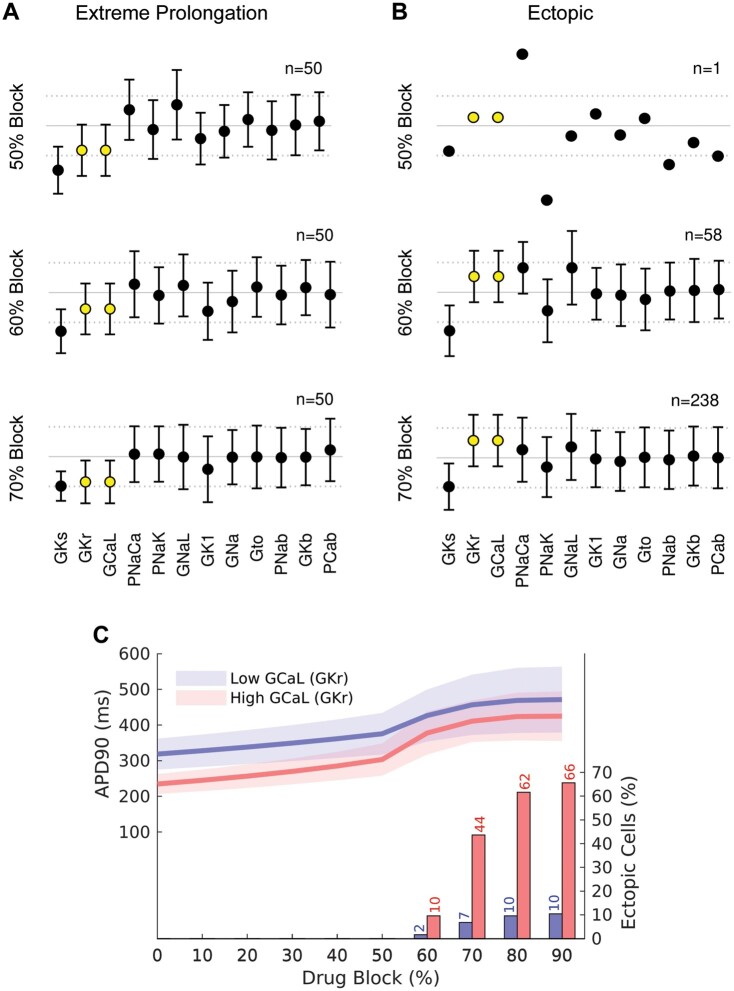
Figure 5.
Scalars (mean±SD) for the population of cells with GKr-GCaL co-expression. (A) 50 cells with the longest APD90 values and no EAD with increasing % IKr block. (B) cells with EADs with increasing % IKr block. The GCaL and GKr scalars are highlighted in yellow. (C) APD90 values (left axis) for the highest (red) and lowest (blue) quartile of cells according to baseline GCaL scalar. The continuous lines show the mean value and shaded area shows ±1 SD. The percentage of EADs in each quartile is shown as columns (see axis on right side of graph). The corresponding plots for the population of cells with independent GKr-GCaL scalars are show in Supplementary material online, Figure S7.

