
Figure 6.
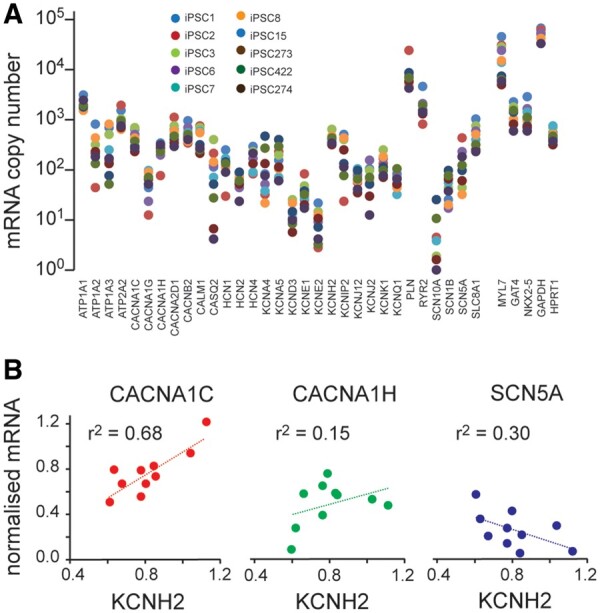
(A) Plot of all mRNAs (log axis) for 10 hiPSC-CM lines. Note that there are high levels of expression of cardiac markers (MYL7 as well as NKX2-5 and GATA4) in all cell lines. In addition, there is less variability in the levels for the housekeeping genes (GAPDH and HPRT1) compared to that seen for the ion channels and calcium handling proteins. The mRNA data for panel (A) are available in the GEO database under accession number GSE146667. (B) Correlation plots for normalized mRNA expression KCNH2 vs. genes that encode the major depolarizing currents (CACNA1C, CACNA1H, and SCN5A). To account for any differences in mRNA loading between runs, levels of expression have been normalized to GAPDH. Normalizing the data to HPRT1 or to the geometric mean of HPRT1 and GAPDH gave very similar results (Supplementary material online, Figure S9). Correlation coefficients for linear fits to the data are shown in each panel.