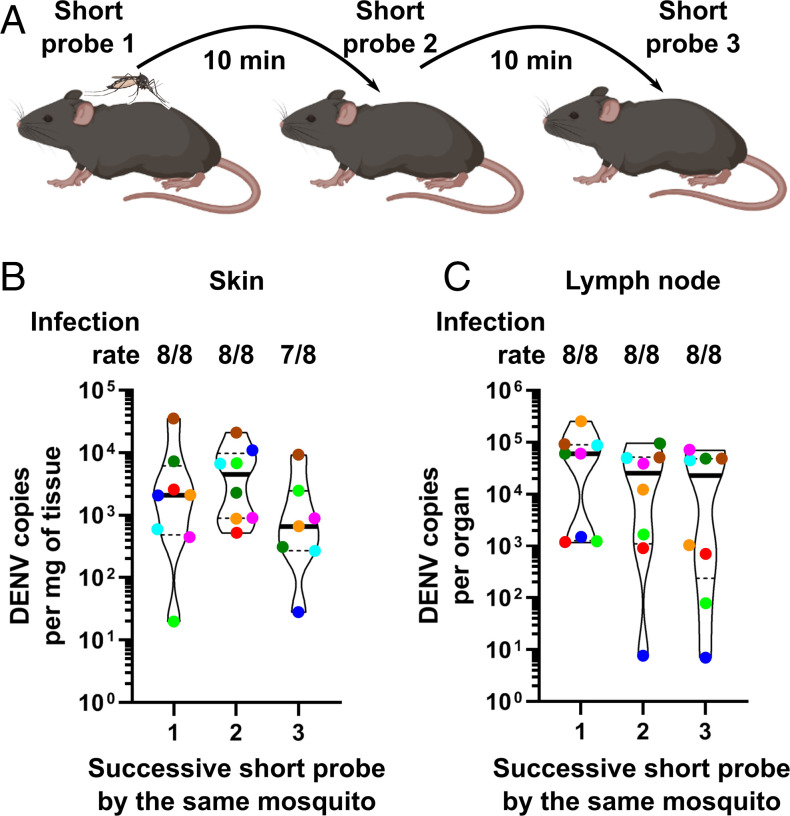
Fig. 4.
Mosquitoes transmit DENV at each successive probe. (A) Schematic of the transmission assay. (B and C) DENV infection in skin (B) and the corresponding draining lymph nodes (C) from three mice successively bitten by the same infected mosquito. Infection rate indicates the number of infected tissues over the number of tissues bitten by different mosquitoes. Violin plots indicate median (thick line) and quartiles (dotted lines). Eight mosquitoes were analyzed, and each had bitten three different mice, totaling 24 different mice. Dots with the same color represent bites by the same mosquito.

