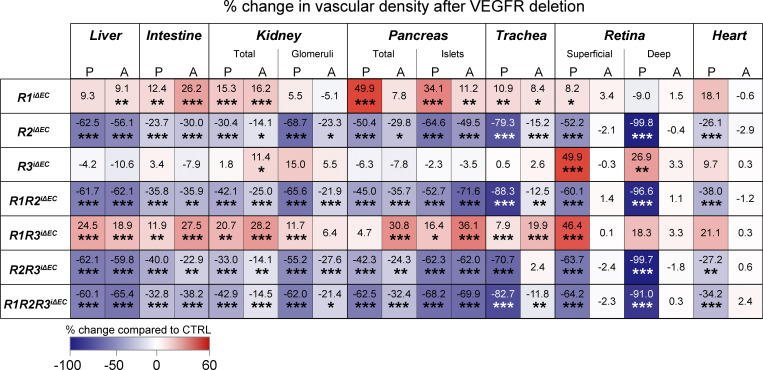
Figure 6.
Quantification of changes in vascular density after Vegfr deletions. Heatmap summary of percent changes in blood vascular densities in postnatal (P) and adult (A) mice quantified from single, double, and triple compound deletions of the VEGFRs in liver, intestine, kidney (total and glomerular), pancreas (total and Langerhans islet–specific), trachea, retina (superficial and deep plexus), and heart tissues. Color scale indicates increased (red) or decreased (blue) vascular area; numbers indicate the percent change as compared with littermate controls. VEGFR1: control [CTRL] = 11–21, R1iΔEC = 10–20 mice pooled from four to six independent experiments; VEGFR2: CTRL = 10–21, R2iΔEC = 10–20 mice pooled from three to five independent experiments; VEGFR3: CTRL = 9–16, R3iΔEC = 7–16 mice pooled from three to five independent experiments; VEGFR1/VEGFR2: CTRL = 10–19, R1R2iΔEC = 12–22 mice pooled from three to six independent experiments; VEGFR1/VEGFR3: CTRL = 13–20, R1R3iΔEC = 15–24 mice pooled from three to five independent experiments; VEGFR2/VEGFR3: CTRL = 11–14, R2R3iΔEC = 9–11 mice pooled from three or four independent experiments; and VEGFR1/VEGFR2/VEGFR3: CTRL = 12–31, R1R2R3iΔEC = 11–30 mice pooled from three to nine independent experiments. Asterisks indicate statistical significance (Student’s t test; two-tailed, unpaired). *, P < 0.05; **, P < 0.01; ***, P < 0.001.

