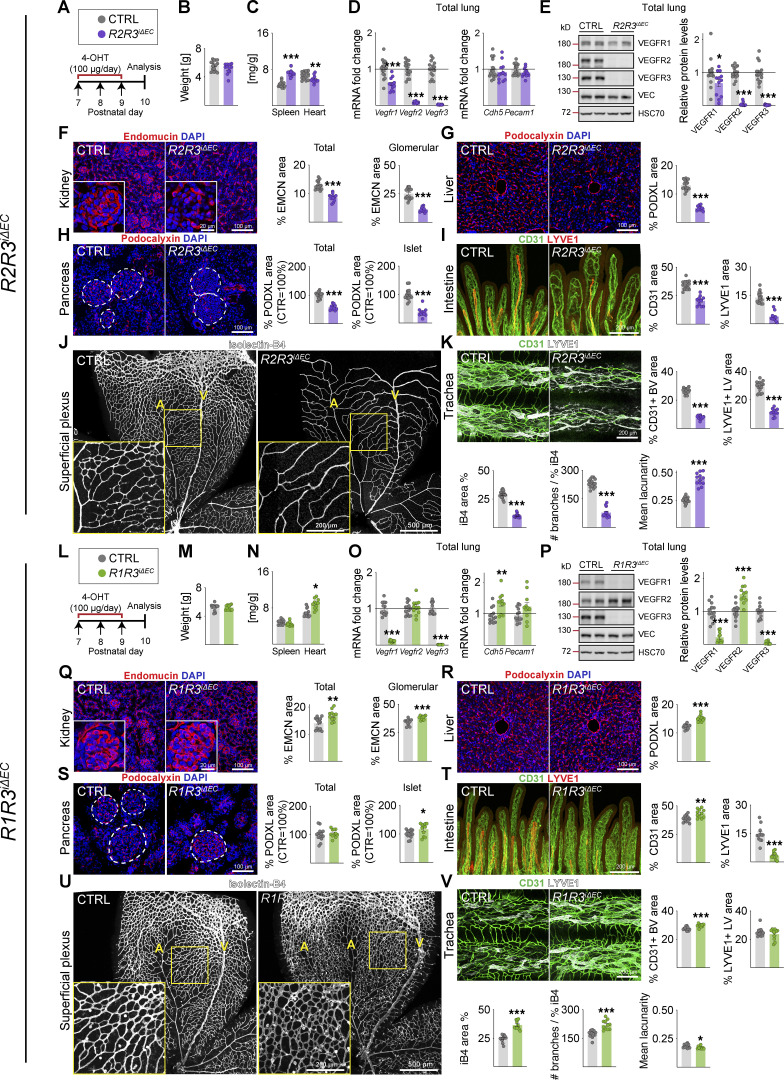
Figure S2.
Vascular phenotypes in postnatal mice after VEGFR2;VEGFR3 deletion or VEGFR1;VEGFR3 deletion. (A and L) Experimental setup. (B and M) Pup weights at P10. (C and N) Spleen and heart weights normalized to body weight. (D and O) Quantification of Vegfr transcripts. (E and P) Western blots and quantifications of VEGFR bands in lung lysates. (F and Q) Staining and quantification of blood vessels (EMCN in red) in kidneys and glomeruli (insets). Scale bar = 100 µm, inset = 20 µm. (G and R) Staining and quantification of blood vessels (PDXL in red) in the liver and (H and S) pancreas; the dashed lines mark Langerhans islets (scale bars = 100 µm). (I and T) Intestinal whole-mounts stained for blood (CD31, green) and lymphatic (LYVE1, red) vessels and their quantification (scale bar = 200 µm). (J and U) EC staining with isolectin B4 (iB4, white) in retinal whole-mounts and their quantification. A, arteries; V, veins. Only the superficial plexus is shown (scale bars = 500 µm, insets = 200 µm). (K and V) Tracheal whole-mount staining and quantification of blood and lymphatic vessels (CD31, green; LYVE1, white, scale bar = 200 µm). EMCN: endomucin; PODXL: podocalyxin. Error bars = mean ± SEM. Control (CTRL) = 16, R2R3iΔEC = 12 mice pooled from four independent experiments were used for the VEGFR2;VEGFR3 deletions. CTRL = 13, R1R3iΔEC = 11 mice pooled from three independent experiments were used for the VEGFR1;VEGFR3 deletions. Statistical significance was determined using Student’s t test (two-tailed, unpaired) with Welch’s correction in case of unequal variances. *, P < 0.05; **, P < 0.01; ***, P < 0.001. BV, blood vessel; LV, lymphatic vessel. Source data are available for this figure: SourceData FS2.

