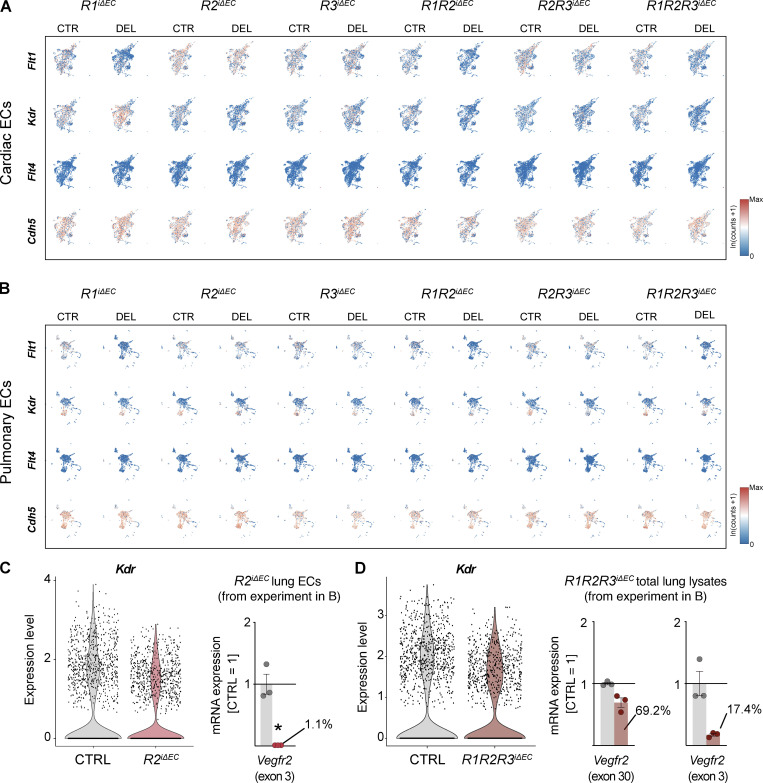
Figure S5.
Feature scRNAseq heatmaps visualizing the expression of Flt1, Kdr, Flt4, and Cdh5 in cardiac and pulmonary ECs of mice with single and compound deletions of VEGFRs versus their controls. (A and B) Cardiac (A) and pulmonary EC (B) datasets are shown. Gene expression scale: low (blue) to high (red). (C) Violin plots for Kdr expression in the R2iΔEC dataset shown in B, suggesting incomplete deletion of Kdr. qPCR of the deleted exon in ECs isolated from the same mice indicates almost complete deletion of exon 3. (D) Violin plots for Kdr expression in the R1R2R3iΔEC dataset and qPCR of exon 30 versus exon 3 sequences. CTRL, control; DEL, deletion.

