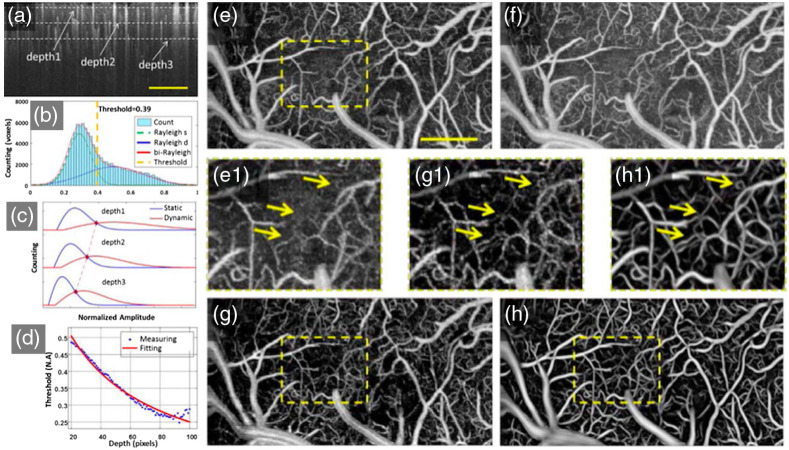
Fig. 13.
Adaptive OCTA classifier using a histogram-based motion threshold and 3D Hessian analysis-based shape filtering. (a) Representative original OCTA cross-sectional angiogram. For the convenience of analysis, three representative depth positions (depth1, depth2, and depth3, marked by the dotted lines) were selected. (b) Histogram of en-face OCTA angiogram at Depth1. The voxel populations of static tissue and dynamic flow can be identified by fitting the histogram analysis. (d) Depth dependence of the OCTA statistics and the motion threshold. MIPs of the 3D OCTA angiogram using the uniform motion threshold of (e) depth1 and (f) depth3, and (g) the depth-adaptive threshold. (h) OCTA angiogram using depth-an adaptive threshold and 3D Hessian-based shape filtering. The . Reproduced with permission, courtesy of Li et al.

