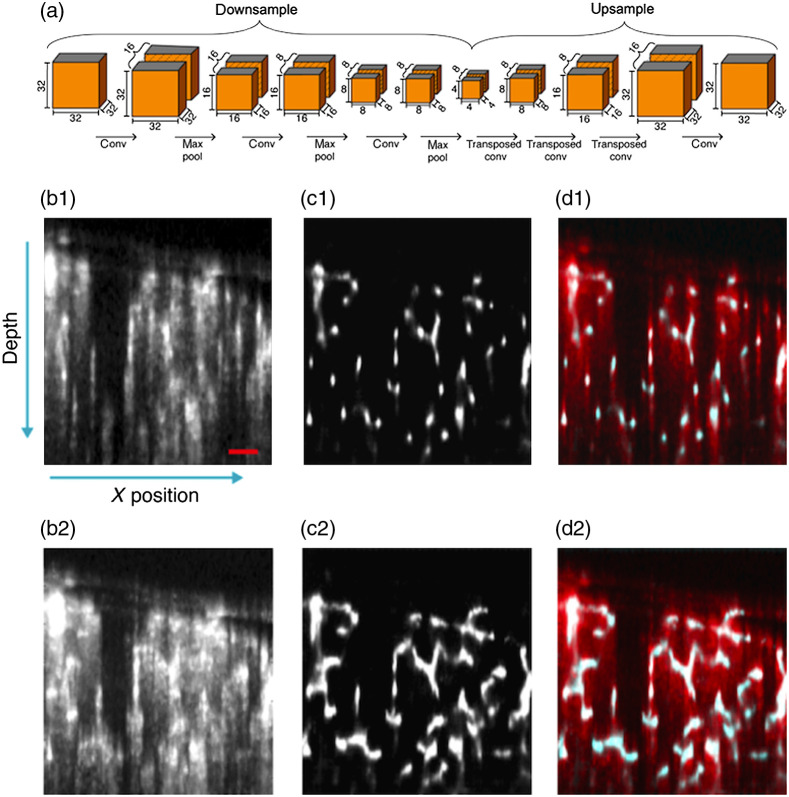
Fig. 14.
(a) Schematic description of encoder–decoder architecture in EnhVess. (b1)–(d2) Comparison of tail artifacts suppression with the original. (b) OCTA, (c) EnhVess, and overlaid result from (b) and (c). (b1)– (d1) Single B-scan images, and (b2) –(d2) MIP over 10 B-scan images. Scale bar, 0.1 mm.

