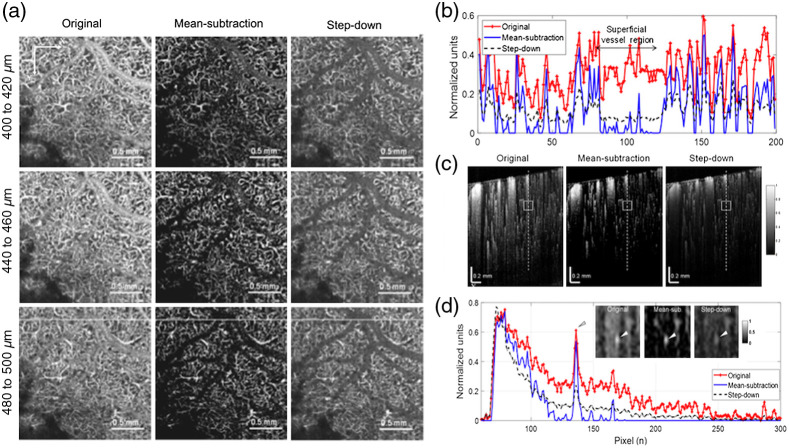
Fig. 8.
(a) Depth-specific comparison of original and artifacts-removal en face OCTA images used the mean-subtraction method and the step-down method. (b) Taken along horizontal white lines on the OCTA images at the bottom of (c). (c) Normalized OCTA cross-sections of mouse cortex: original (left), processed with the mean-subtraction method (middle) and the step-down method (right). (d) Depth profiles taken along the dashed lines in (c) showing largely reduced tails for both methods. Inserts in the graph are regions of interest indicated as boxes in (c), and arrows represented underlying vessel, which is brighter and easily identified with the proposed method. Reproduced with permission, courtesy of Choi et al.

