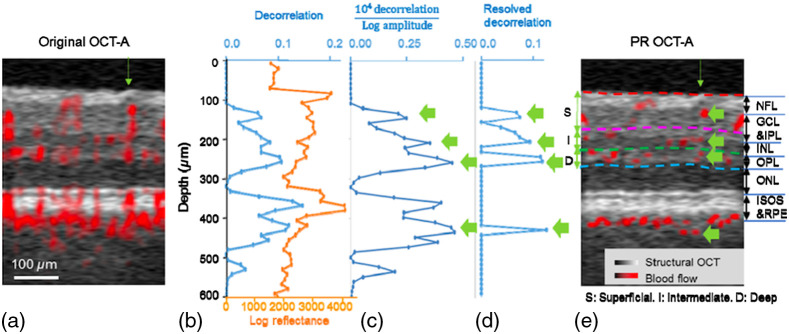
Fig. 9.
Illustration of PR-OCTA for blood vessel tail artifacts suppression. (a) Original cross-sectional image before artifacts suppression. (b) Original decorrelation and log amplitude values of the A-line pointed to by the green arrow in (a). (c) Decorrelation normalized by log amplitude according to data shown in (b). Four highest peaks (green arrows) in this curve were identified as blood vessels. (d) Decorrelations plot after cleaning up by the PR algorithm–decorrelation values besides vessels were set to zero. (e) Cross-sectional OCTA image after PR-OCTA processing. Four vessels are identified with green arrow, as shown in (c) and (d). Reproduced with permission, courtesy of Zhang et al.

