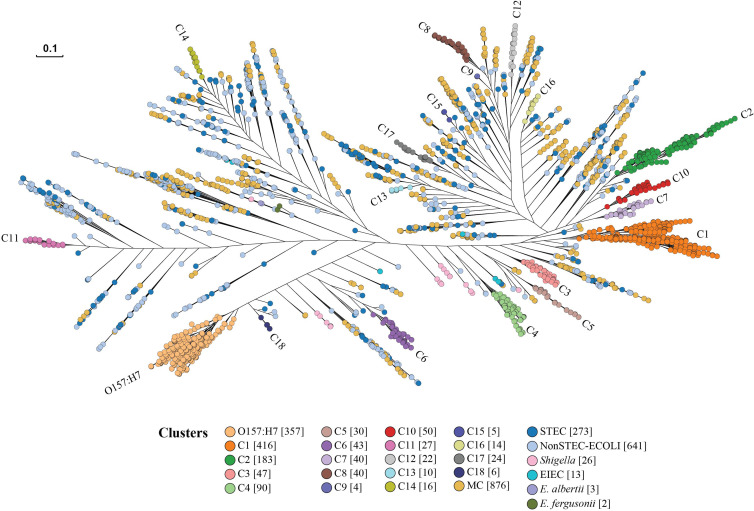
Figure 3.
STEC cluster identification phylogenetic tree. Representative isolates from the identification dataset were used to construct the phylogenetic tree by Quicktree v1.3 to identify STEC (Shiga toxin-producing E. coli) clusters and visualised using Grapetree. The dendrogram shows the phylogenetic relationships of 2,567 STEC isolates represented in the identification dataset. Branch lengths are log scale for clarity. The scale bar represents 0.1 substitutions per site. STEC clusters are coloured. Numbers in square brackets after cluster name are the number of isolates for each identified cluster. ECOLI is E. coli. EIEC is Enteroinvasive E. coli. MC indicates a minor STEC cluster.

