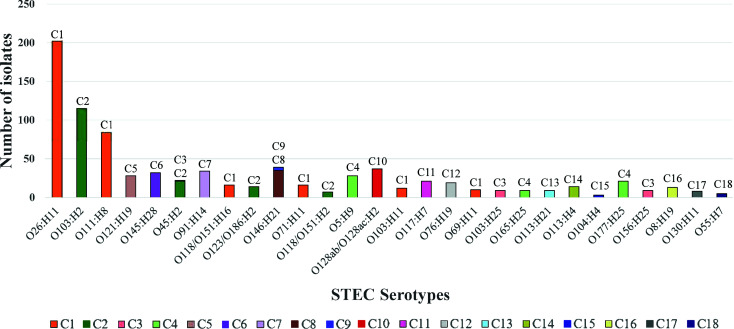
Figure 4.
The frequency of the top 28 non-O157:H7 STEC serotypes in STEC major clusters. The graph shows the frequency of top 28 non-O157:H7 serotypes in the 18 STEC major clusters. Clusters are shown per colour legend and also at the top of the bar. X-axis shows the serotype while y-axis shows the number of isolates.

