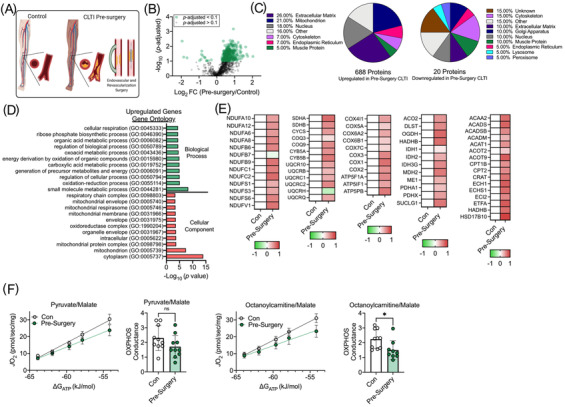
FIGURE 3.

Mitochondrial signature is not present in CLTI prior to surgical intervention. (A) Proteome comparison and (B) Volcano plot between non‐PAD controls and CLTI patients prior to surgical intervention. (C) Pie charts depicting the proportions of differentially expressed proteins (upregulated and downregulated) by cellular organelle/component. (D) Gene ontology identifies upregulation of mitochondrial proteins in CLTI specimens prior to surgical intervention. (E) Heat maps of select mitochondrial protein abundances (Log2 fold change). (F) Functional analysis of muscle mitochondria identified a modest impairment in fatty acid oxidation but no difference in carbohydrate oxidation (n = 9‐10/group). *P < 0.05 using two‐tailed t‐test
