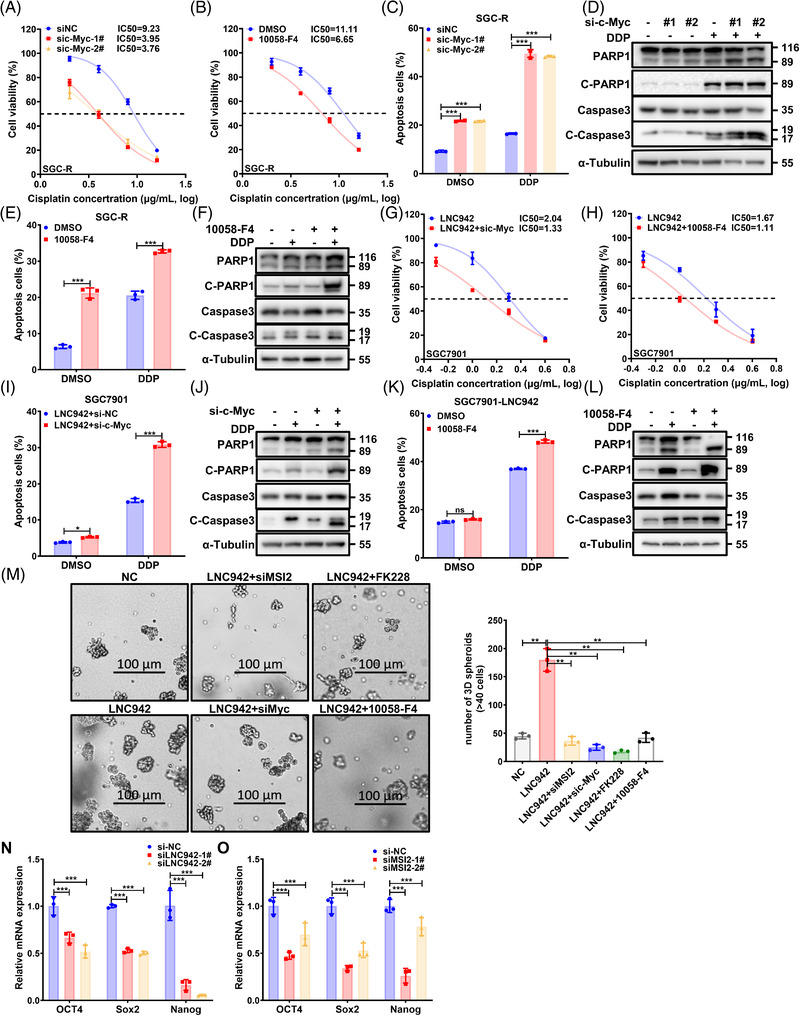
FIGURE 7.

c‐Myc promotes gastric cancer cell resistance to cisplatin in vitro. (A) The assessment of the viability of SGC‐R cells transfected with control or c‐Myc siRNAs with or without cisplatin (DDP) treatment for 24 h by using the MTS assay. (B) The effect of c‐Myc inhibition using the chemical c‐Myc inhibitor 10058‐F4 (6.25 μg/ml) on the viability of resistant cells with or without DDP treatment for 48 h, as detected by the MTS assay. (C and D) SGC‐R cells transfected with control siRNA (si‐NC) or c‐Myc siRNAs were treated with or without DDP (8 μg/ml) for 24 h, and the apoptosis level was measured by flow cytometry (C) as well as western blotting (D). (E and F) SGC‐R cells were pre‐treated with 10058‐F4 (6.25 μg/ml) for 24 h, followed by treatment with or without DDP (8 μg/ml) for 24 h, and the apoptosis level was measured through flow cytometry (E) and western blotting (F). DMSO: solvent control of 10058‐F4. (G) SGC7901 cells stably overexpressing LNC942 were transfected with c‐Myc siRNAs and treated with different concentrations of DDP for 24 h, after which the cell viability was measured using the MTS assay. (H) SGC7901 cells stably overexpressing LNC942 were pre‐treated with 10058‐F4 (6.25 μg/ml) for 24 h and co‐treated with different concentrations of DDP for 24 h, after which the cell viability was measured using the MTS assay. (I and J) SGC7901 cells stably overexpressing LNC942 were transfected with c‐Myc siRNAs for 48 h and treated with DDP (1 μg/ml) for 24 h, after which the apoptotic cells were analysed through flow cytometry (I) and western blotting (J). (K and L) SGC7901 cells stably overexpressing LNC942 were pre‐treated with 10058‐F4 (6.25 μg/ml) for 24 h and co‐treated with DDP (1 μg/ml) for 24 h. Apoptotic cells were analysed through flow cytometry (K) and western blotting (L). (M) The size and number of 3D‐cultured spheroids of LNC942 overexpressed or control SGC7901 with MSI2 or c‐Myc inhibition were measured by a 3D culture system. Spheroid size >40 cells per case was counted by ImageJ as one spheroid. (N and O) Pluripotent transcription factors were analysed in LNC942 (N) or MSI2 (O)‐depleted cells by quantitative real‐time PCR (qRT‐PCR). Data in (A‐C), (E), (G‐I), (K), (M‐O) panels are represented as mean ± SD of the three independent experiments; the p value was determined using a two‐tailed unpaired Student's t test. ns, p > .05; *p < .05; **p < .01; ***p < .001
