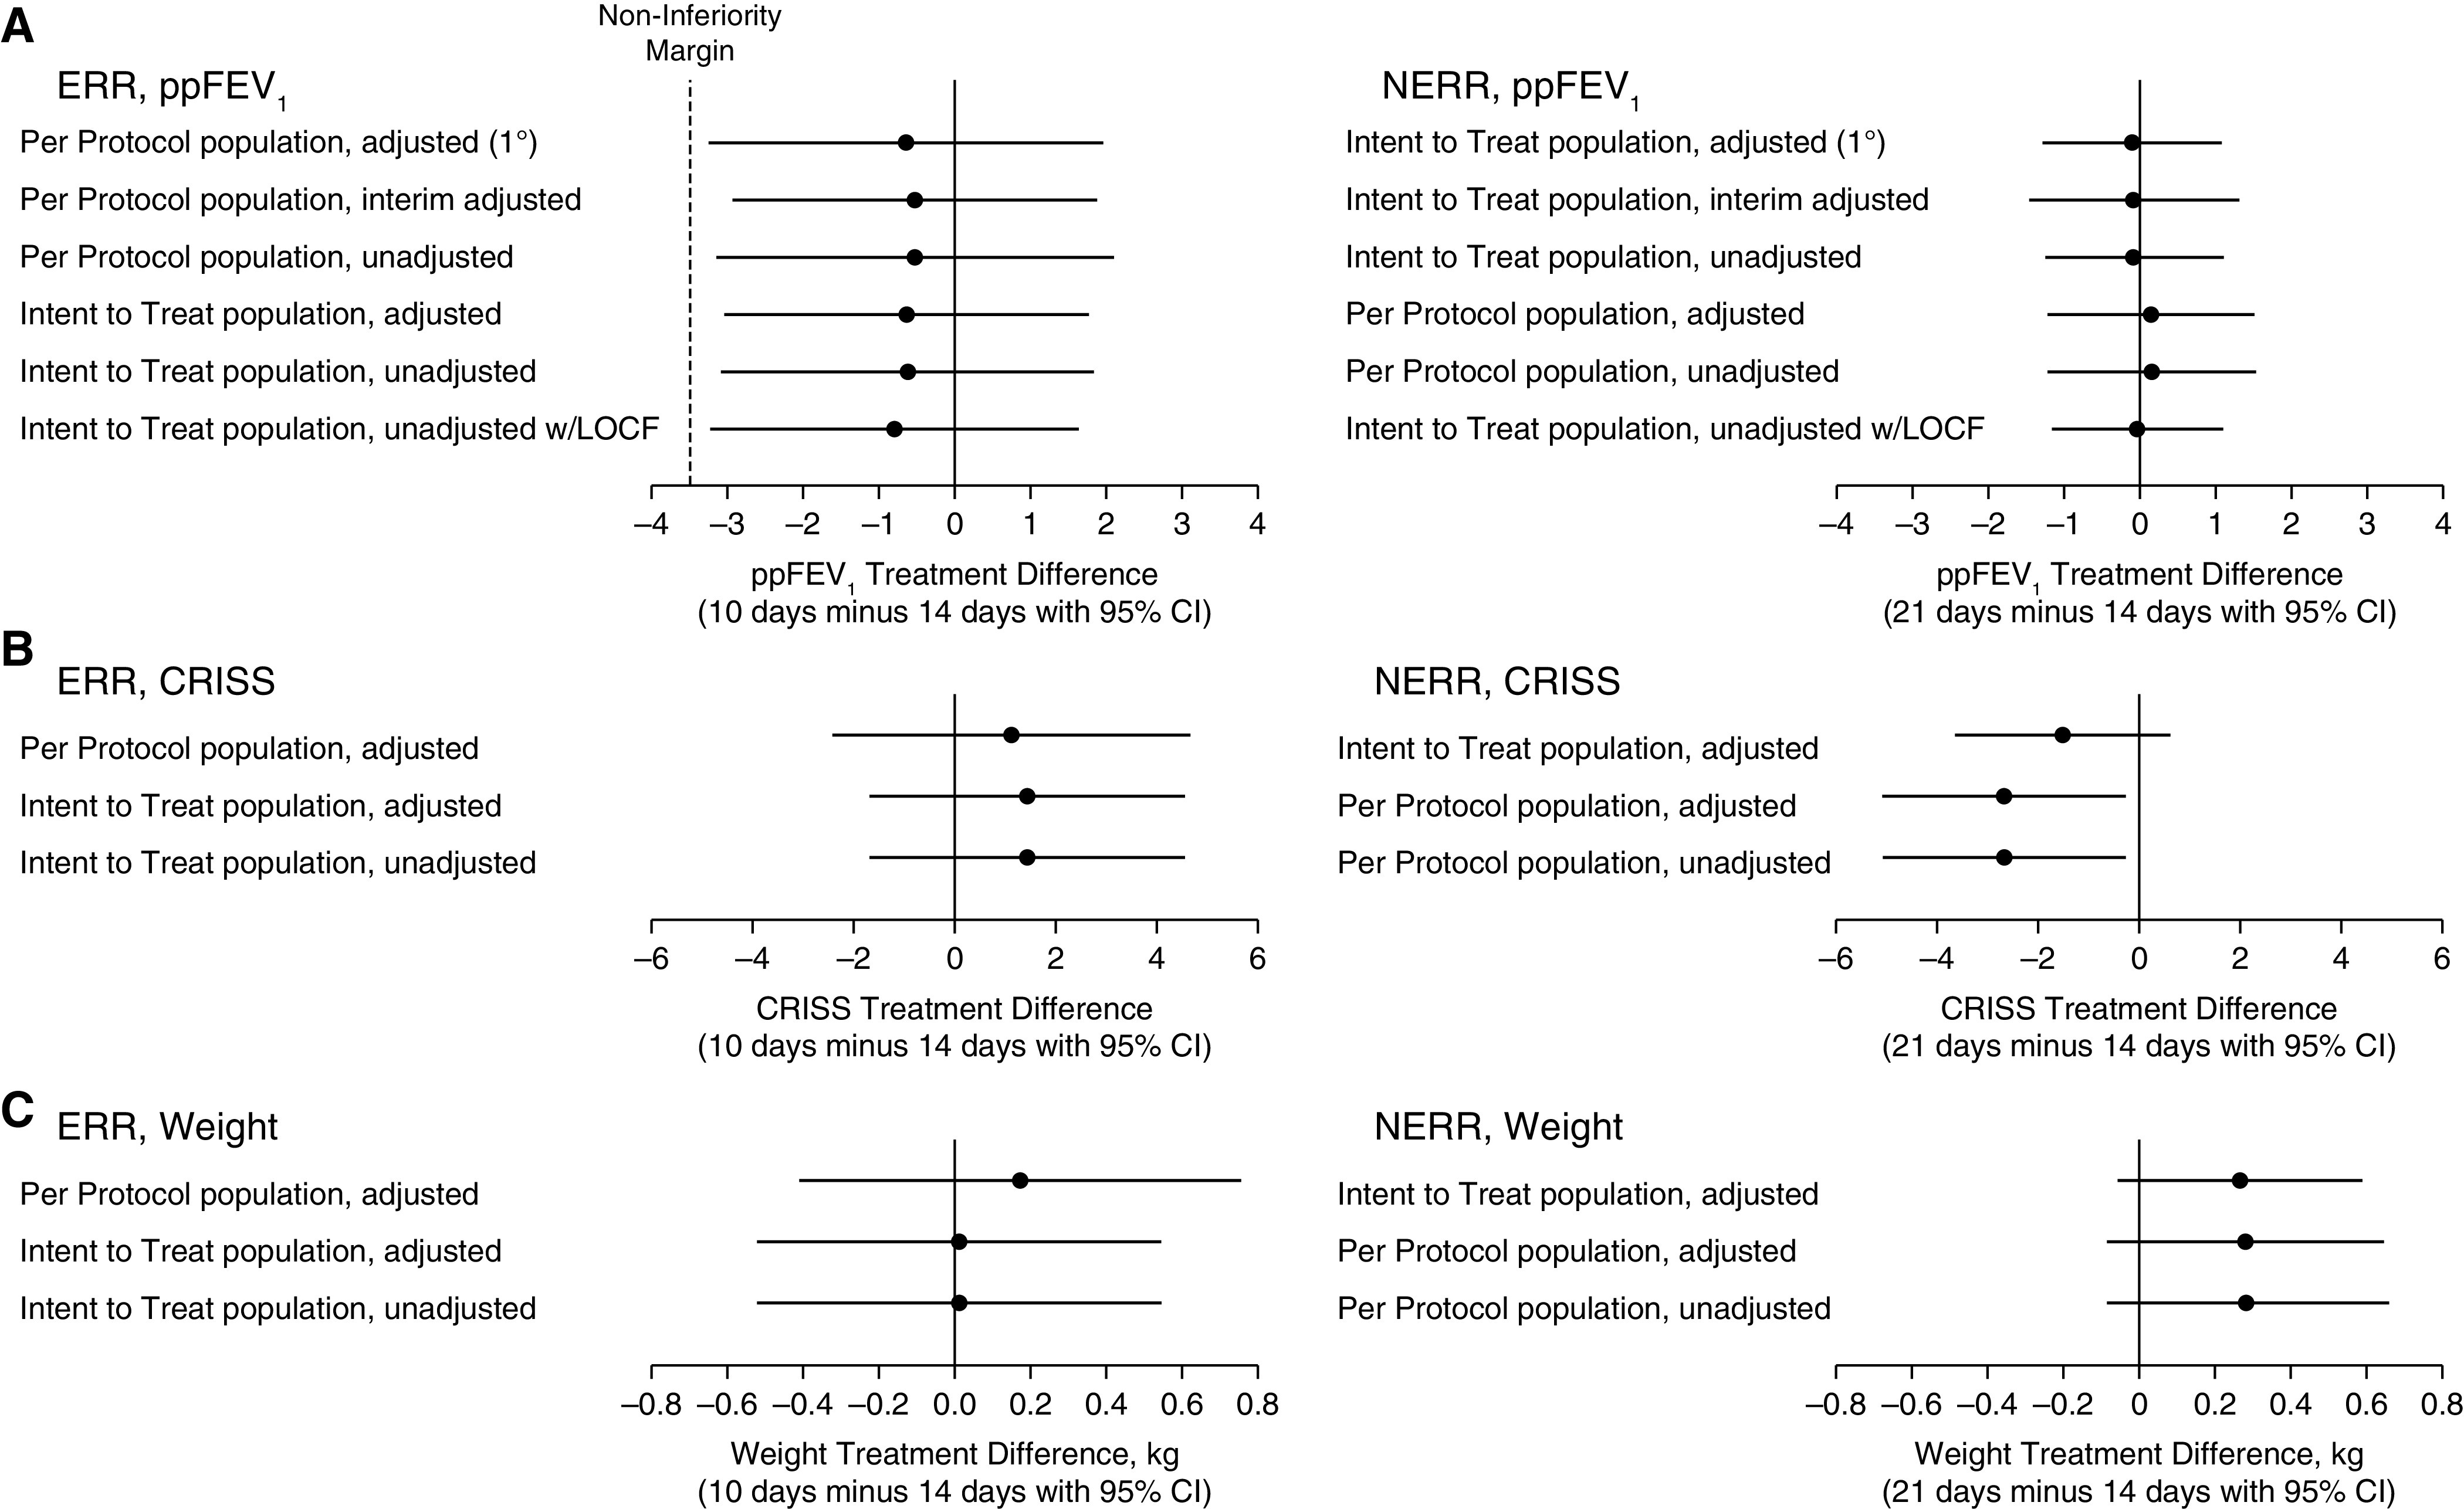
Figure 3.

Point estimates and 95% confidence intervals for treatment differences in sensitivity analysis populations: (A) Primary endpoint ppFEV1 change from visit 1 to visit 3; (B) CRISS change from visit 1 to visit 3; (C) weight change from visit 1 to visit 3. Adjusted = ANOVA adjusted for randomization strata: ppFEV1 < 50%, location of intravenous treatment, corticosteroid use, and history of PEx in the year before. Interim adjusted = bias adjustment for interim analyses (according to prespecified boundary parameters). CI = confidence interval; CRISS = Chronic Respiratory Infection Symptom Score; ERR = early robust responder; LOCF = last observation carried forward; NERR = non–early robust responder; PEx = pulmonary exacerbations; ppFEV1 = percent of predicted FEV1.
