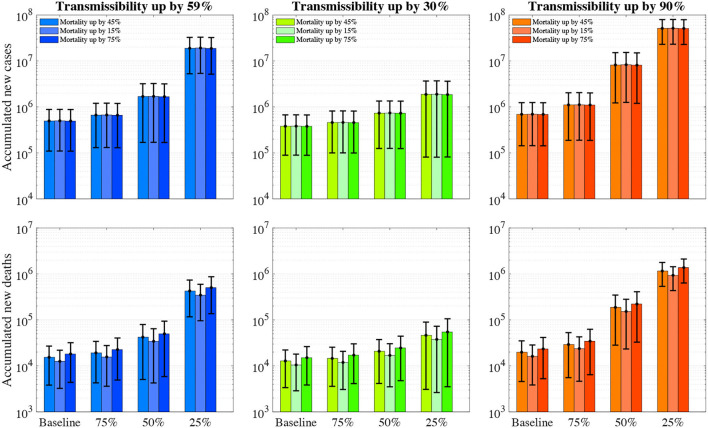
Figure 2.
The number of accumulated new COVID-19 infections and deaths over the next 12 months with varying vaccine effectiveness, viral transmissibility and mortality. The first row represents the accumulated number of new infections whereas the second row represents accumulated deaths. The colour (blue, green, and orange) bars denote the varying transmissibility of SARS-CoV-2 variants. The error bars represent 95% confidence intervals.

