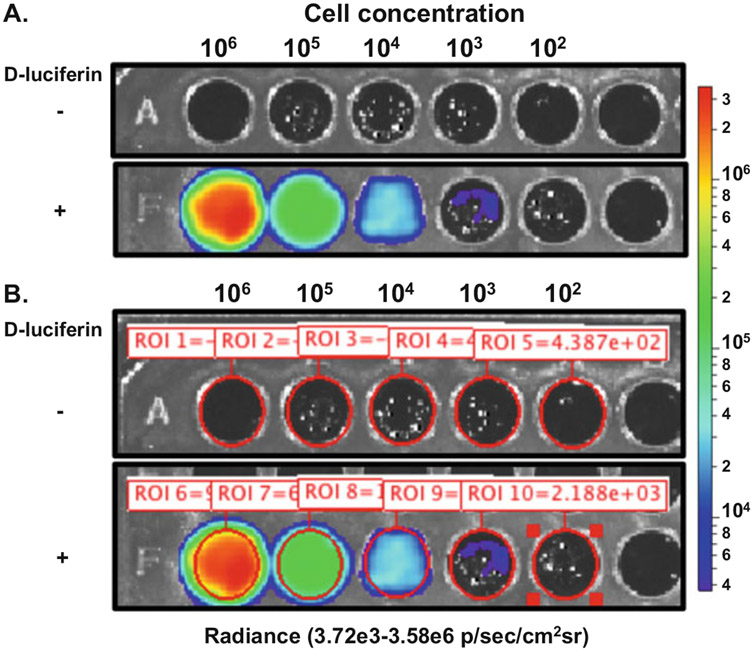
Fig. 1.
B. burgdorferi in vitro bioluminescence assay using Perkin Elmer IVIS Spectrum Imaging System. ML23 pBBE22luc was grown to mid-exponential growth phase under microaerophilic conditions. Colorimetric scale on the right indicates the intensity of bioluminescence as it relates to the different number of cells evaluated. (a) B. burgdorferi, tenfold serially diluted from 106 to 102 cells, were plated in duplicate with one set treated with 667 μM d-luciferin as indicated by the +. The row designated – was not treated with d-luciferin to serve as a background control. The image was captured after a 1 min incubation with a 1 min exposure and a binning setting of medium. (b) Region of interest (ROI) was set for each well containing B. burgdorferi as defined by the red circle and accompanying ROI number and measurement

