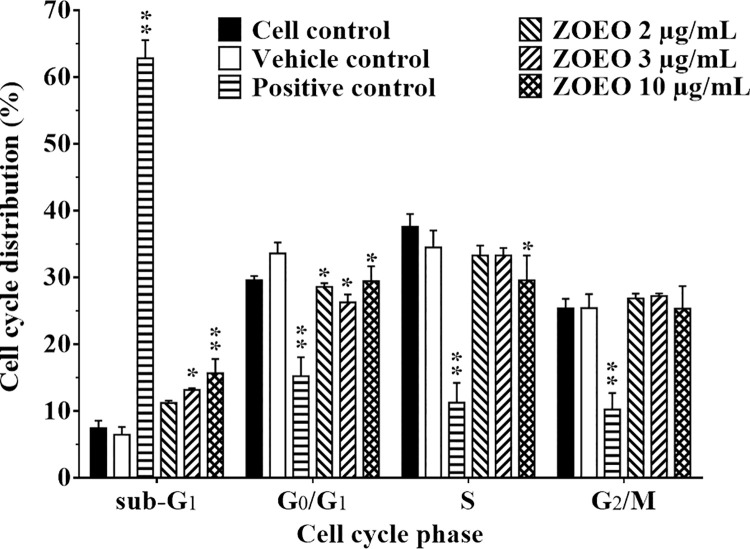
Fig 4. Representative bar graph of cell cycle phases of MCF-7 cells after 48 h exposed to various concentrations of ZOEO in comparison with the controls.
Each bar represents mean ± SD of three independent experiments performed in triplicate. Asterisk (*) denotes significant differences from vehicle control; * p < 0.05; ** p < 0.001. The dataset is available in S6 Table.

