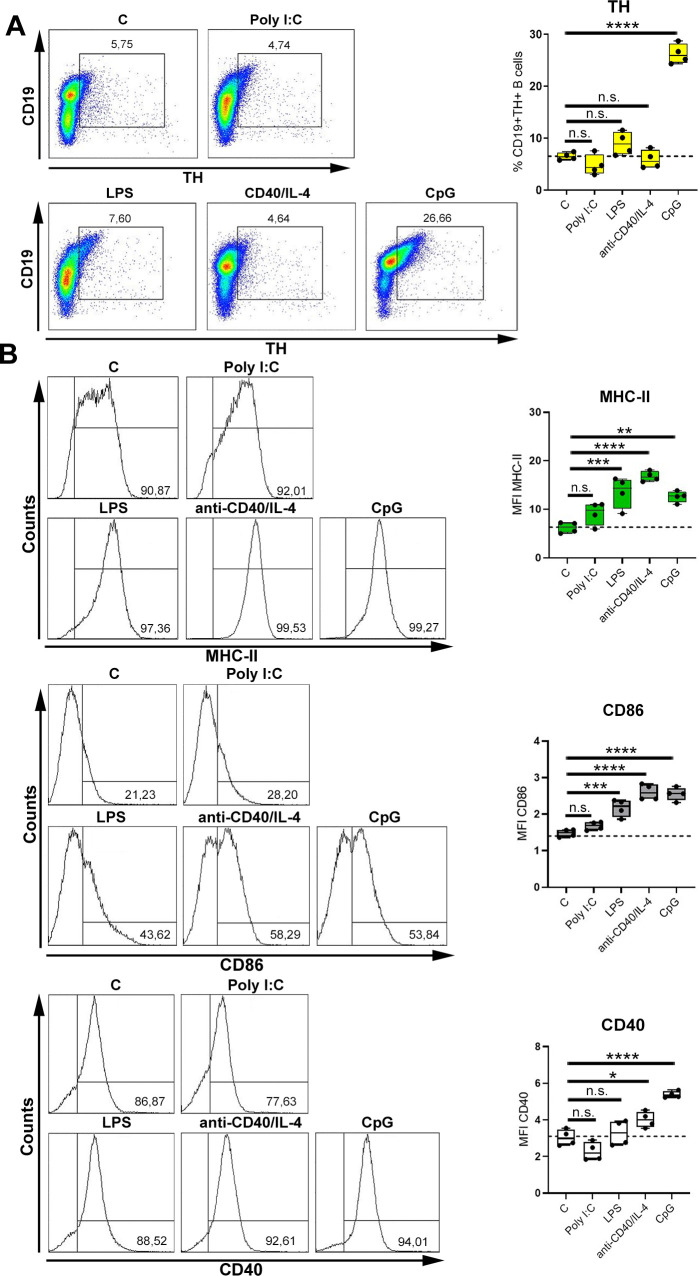
Fig 3. TLR9 activation induces TH expression in B cells.
(A, B) B cells were activated with the TD stimulus anti-CD40 (1.25 μg/mL) in combination with IL-4 (1.25 ng/mL) or with the different TI-stimuli (Poly I:C (TLR3; 1.25 μg/mL), LPS (TLR4; 1.25 μg/mL) and CpG (TLR9; 1.25 μg/mL) for 24 h. As control group, nonactivated B cells were used. The expression of CD19+TH+ B cells (A; n = 4) and the MFI of MHC-II+, CD86+ and CD40+ B cells (B; n = 4) were quantified by flow cytometry. One representative dot plot (A) or histogram (B) is shown. B cells from naive DBA/1J mice were used for experiments. Statistical significance was determined by ordinary 1-way ANOVA followed by Dunnett multiple comparison test (A, B). n.s., not significant; *p < 0.5; **p < 0.01; ***p < 0.001; ****p < 0.0001. For underlying data, see S1 Data. ANOVA, analysis of variance; IL, interleukin; LPS, lipopolysaccharide; MFI, median fluorescence intensity; TD, T cell–dependent; TH, tyrosine hydroxylase; TI, T cell–independent; TLR, Toll-like receptor.

