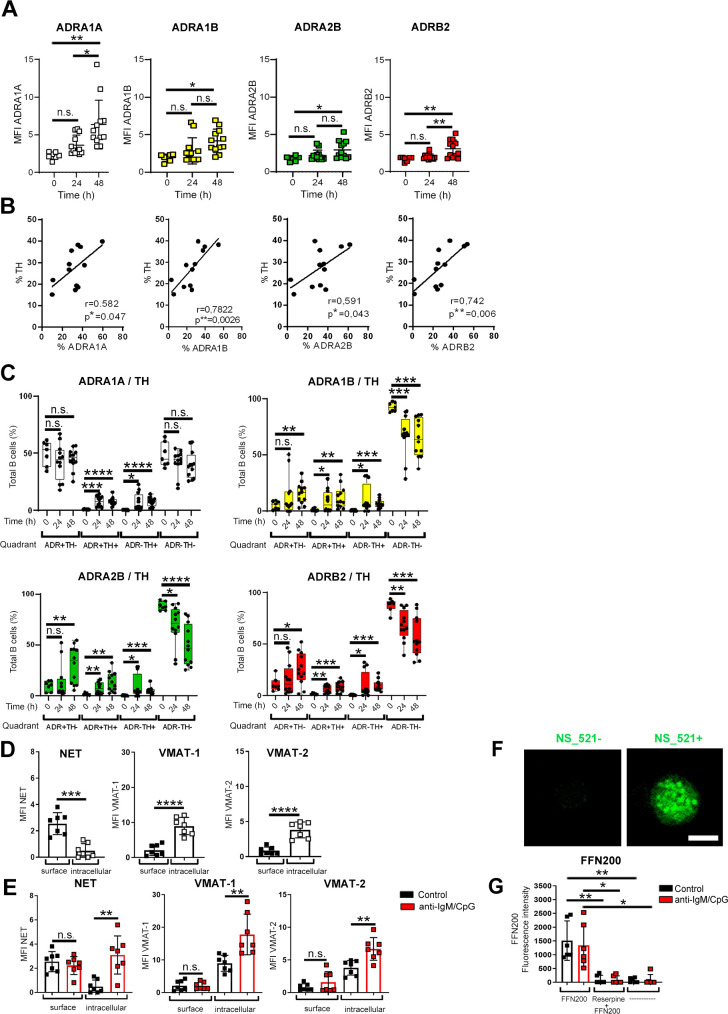
Fig 4. B cells express catecholamine receptors and transporters.
(A–C) B cells were activated with anti-IgM/CpG for 24 h and 48 h. Nonactivated B cells were used as control group (0 h). (A) MFI of all ADRs analyzed (0 h: n = 7; 24 h, 48 h: n = 12) was determined by flow cytometry. The gating strategy is available in S6A Fig. (B) The correlation of TH and ADR expression was quantified after 48 h (n = 12). (C) The expression of different ADRs and TH expression (ADR+TH−, ADR+TH+, ADR−TH+, and ADR−TH−) was analyzed by flow cytometry (0 h: n = 7; 24, 48 h: n = 12). The gating strategy and representative dot plots of control group (0 h) and after activation (48 h) are shown in S6B Fig. (D, E) Nonactivated B cells (D) or anti-IgM/CpG-activated B cells (E) were cultivated for 24 h. The MFI of labeled monoamine transporters was determined by flow cytometry (n = 7). The gating strategy is available in S6C Fig. (F) Nonactivated B cells were stained with NS_521 (10 μM) for 30 min at 37°C and 5% CO2. Catecholamine-producing B cells were analyzed by immunofluorescence histology. Fluorescent images were captured at 40× magnification using Zeiss AxioVision microscope. One of 3 representative images is shown. Scale bar = 5 μm (n = 3). (G) Nonactivated and activated B cells were treated with reserpine for 45 min or left untreated. Afterward, the cells were incubated with FFN200 dihydrochloride (10 μM) for 1.15 h. FFN200 dihydrochloride- and reserpine-untreated cells were used as controls. The fluorescence intensity of FFN-200 dihydrochloride was measured by plate multimode reader (n = 6). For the experiments, B cells from naive DBA/1J mice were used. Data are pooled from 5 experiments (A–C). Statistical significance was determined by 1-way ANOVA followed by Tukey multiple comparison test (A), Brown–Forsythe, and Welch ANOVA tests followed by Dunnett T3 multiple comparison test (C, G), Student t test (D, E). Continuous variables were analyzed using linear regression with r values calculated by Pearson correlation (B). n.s., not significant; *p < 0.5; **p < 0.01; ***p < 0.001; ****p < 0.0001. For underlying data, see S1 Data. ADR, adrenergic receptor; ANOVA, analysis of variance; MFI, mean fluorescence intensity; NS_521, neurosensor_521; TH, tyrosine hydroxylase.

